
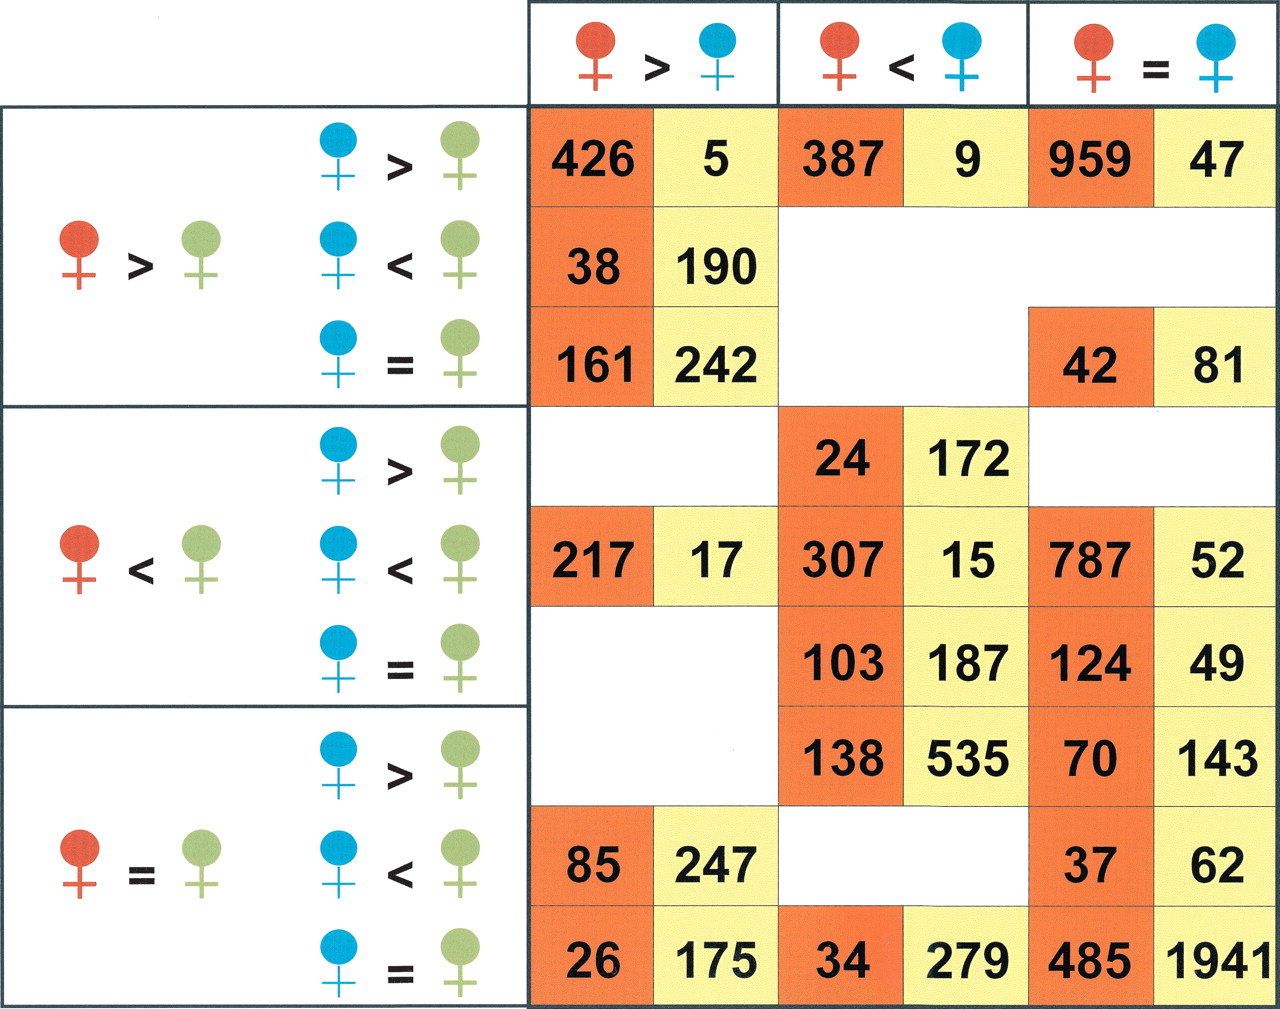
Classification of the cDNAs assayed according to the relationships at expression level among D. melanogaster (red), D. simulans (blue), and hybrid (green) in whole-body (orange cells) and heads only (yellow cells) experiments. Only the 4450 array elements regarded as consistent with the Bayesian methodology (Townsend and Hartl 2002) in the whole-body analysis have been included (Methods); in the case of the experiments with head mRNA, no reliable estimate was obtained by Bagel for two of the 4450 array elements considered. The logical operators (=, <, >) denote the relationship among the 95% credible intervals of the mean expression levels obtained for the three kind of females. The number that appears in a particular cell shows the total number of genes on our cDNA microarray that meet the three different conditions under which each gene can be classified. The eight empty cells correspond to mutually incompatible requirements. See Supplemental Figure 2 for numerical code of the cells in orange.


