
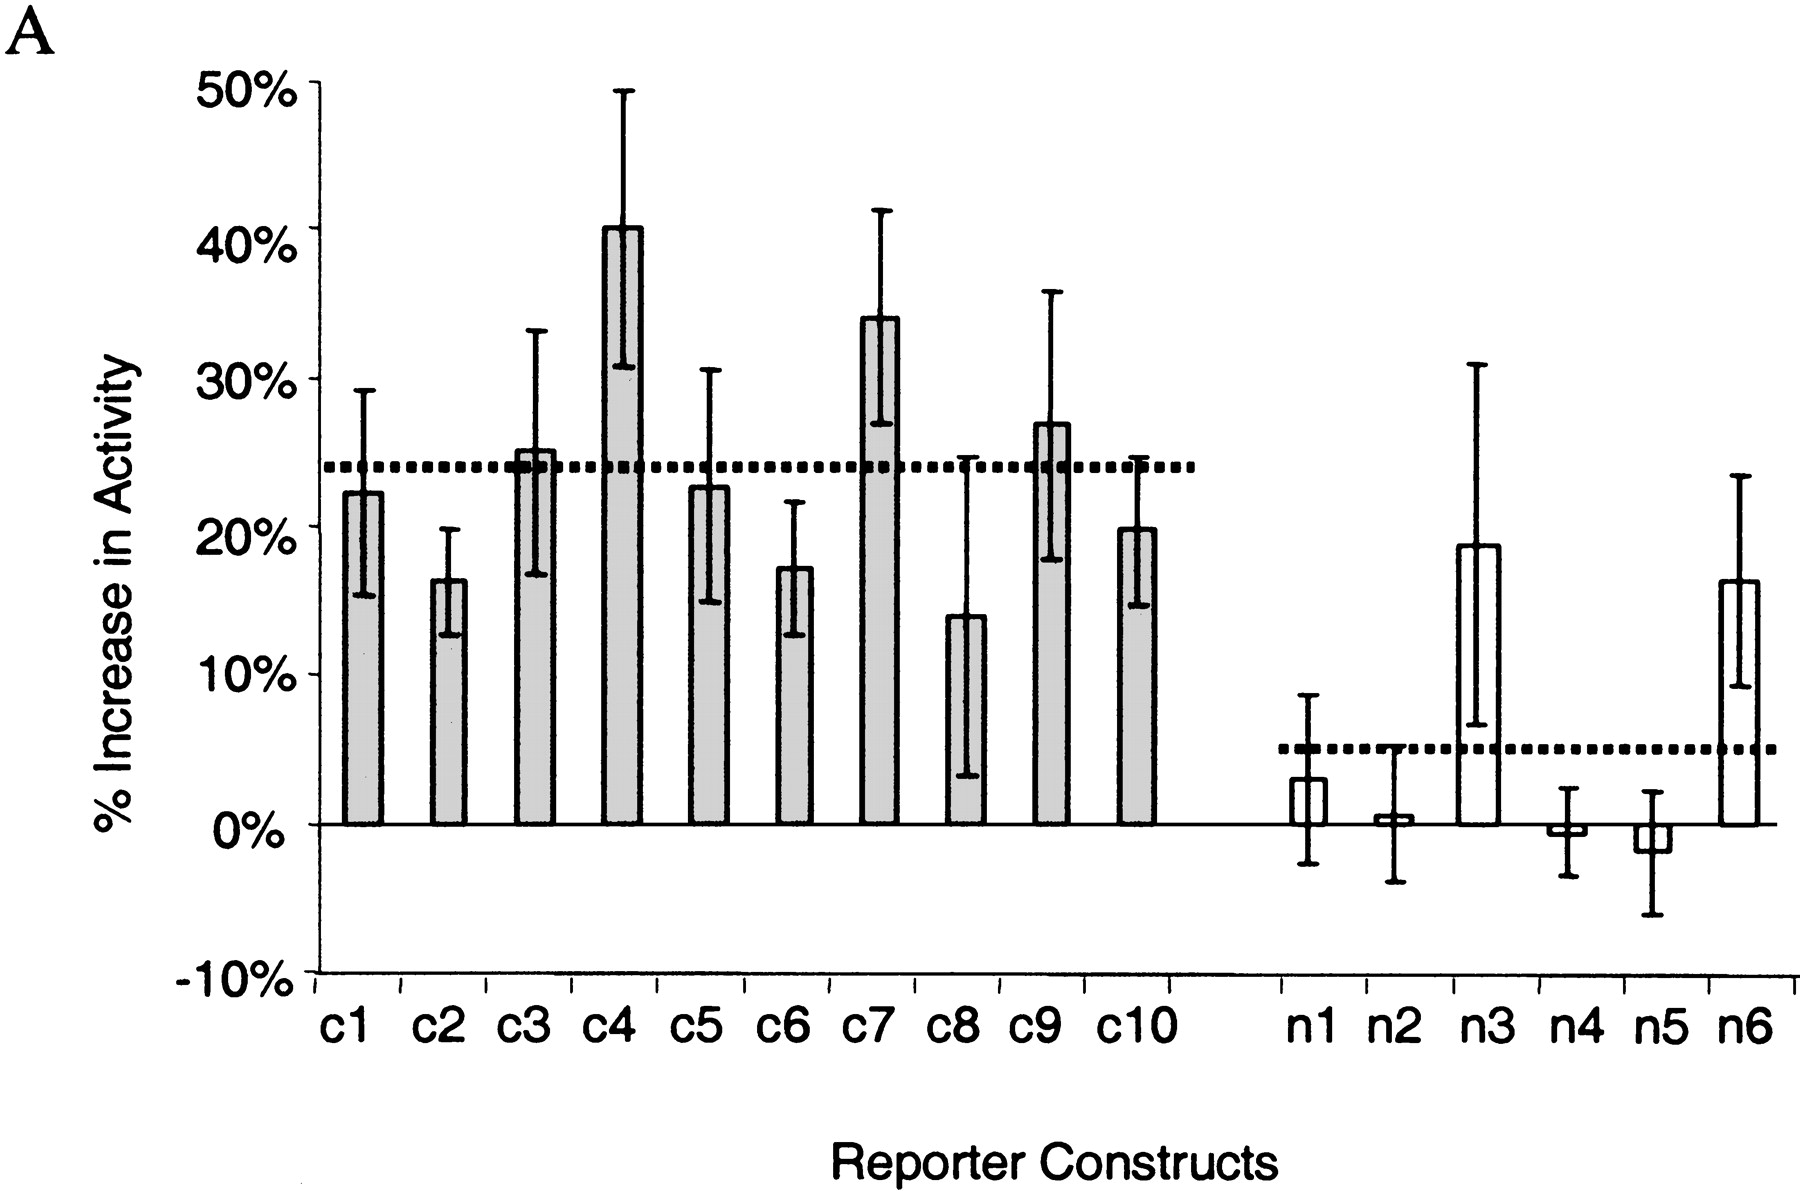
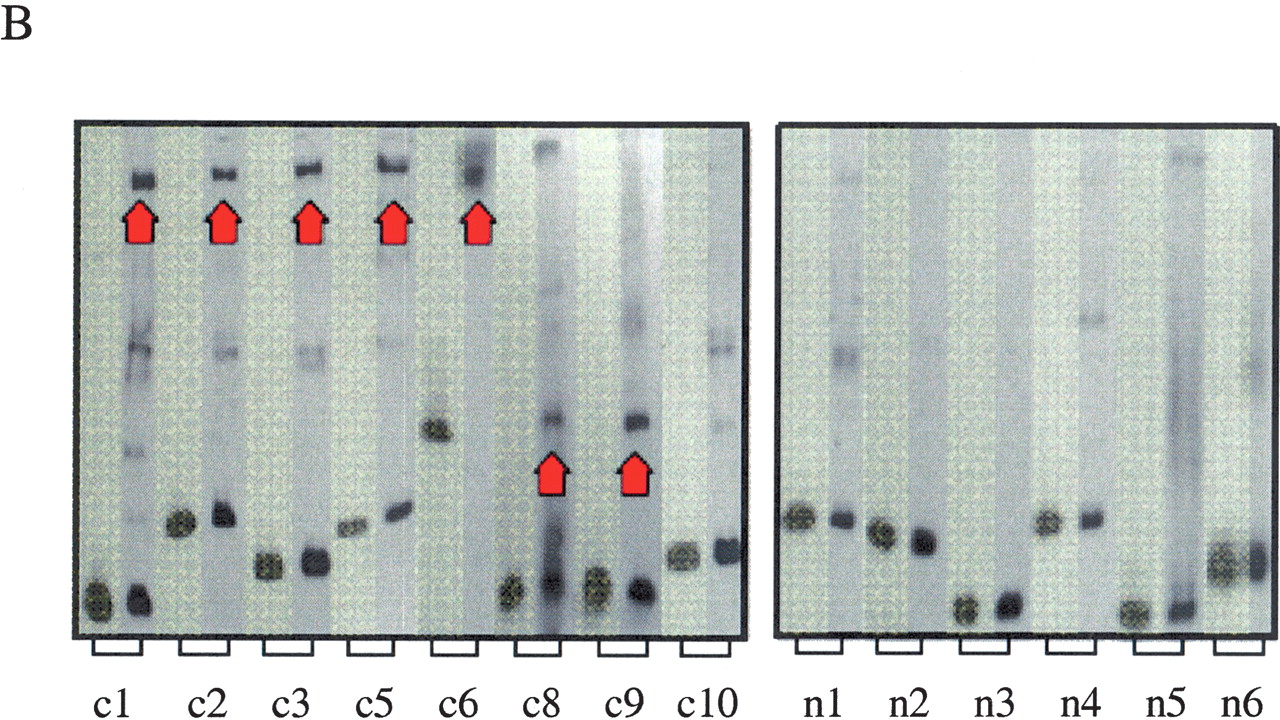
Functional characterization of noncoding sequences. (A) Expression values of 16 independent luciferase reporter constructs as assayed by transfection analysis; (filled bars) conserved noncoding sequences; (open bars) nonconserved noncoding sequences inserted in front of the SIM2 promoter (see Fig. 3A). Luciferase expression values, normalized against β-galactosidase expression values, are averages of 12 individual experiments (each construct was analyzed in triplicate on four different days) and are expressed as the percent increase in activity over the control (the luciferase reporter construct containing only the SIM2 promoter). The means across conserved and nonconserved sequences (dotted lines) were significantly different (P ∼ 0.0047, two sample t-test). Error bars, one SD. (B) Electrophoretic mobility-shift patterns of noncoding DNA fragments. (Lane 1, highlighted) DNA fragment alone; (lane 2) DNA fragment incubated with nuclear extract. (Red arrows) Band-shift indicating DNA–protein binding. Conserved elements c4 and c7 were too long for gel-shift analysis.


