
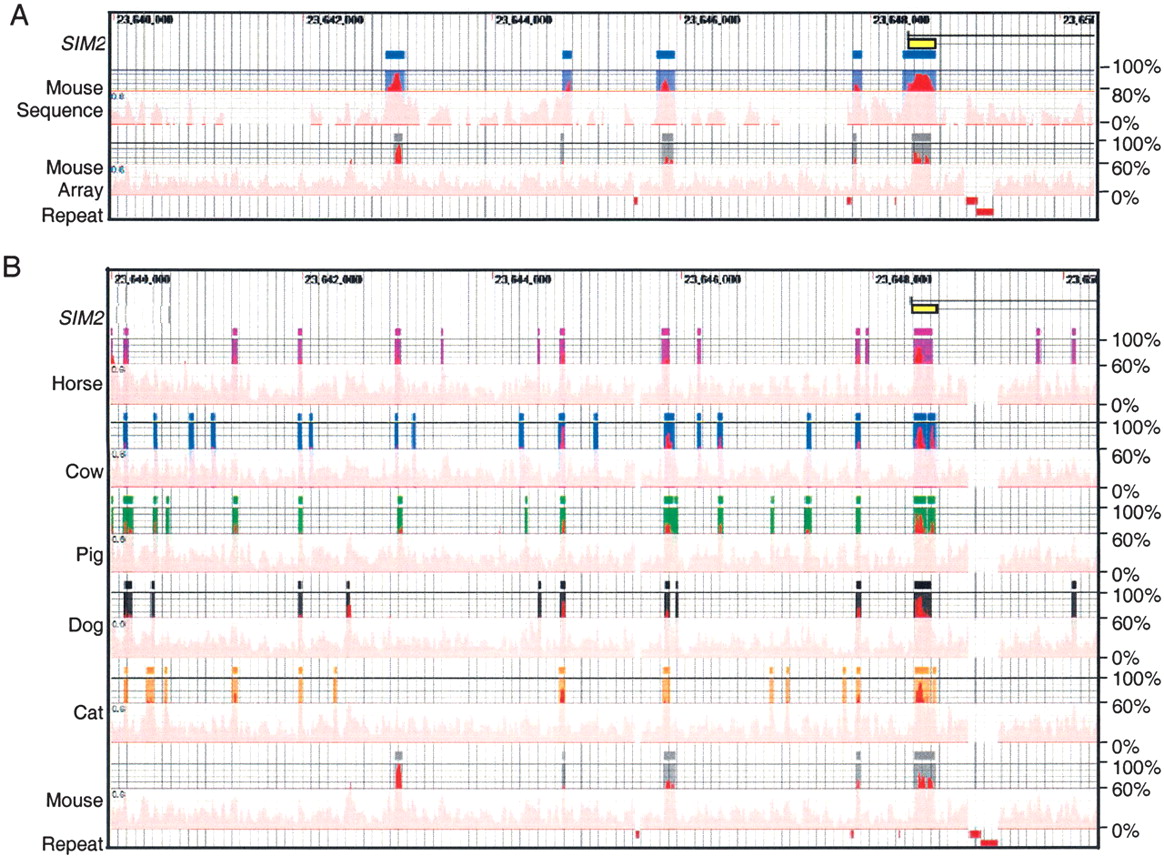
Conserved human sequences in the 10-kb interval surrounding the first exon of SIM2 (yellow rectangle). The conserved elements are shown relative to their position in the human reference sequence (horizontal axis), and their percent conformances (vertical axis). (Position numbers) The position on human 21q (NCBI contig NT_002836). (A) Rectangles rising above the veil indicate conserved human–mouse elements identified by two methods; (blue) sequence alignment (≥100 bp and 80% identify); (gray) 21q array data (≥30 bp and 60% conformance). Red rectangles at the bottom indicate the positions of interspersed repeats, which were not tiled on the arrays, and therefore, conformance information is absent. (B) Rectangles indicate conserved human elements (≥30-nt length and ≥60% conformance) identified by comparisons of horse, cow, pig, dog, cat, and mouse DNA by hybridization to human 21q arrays.


