
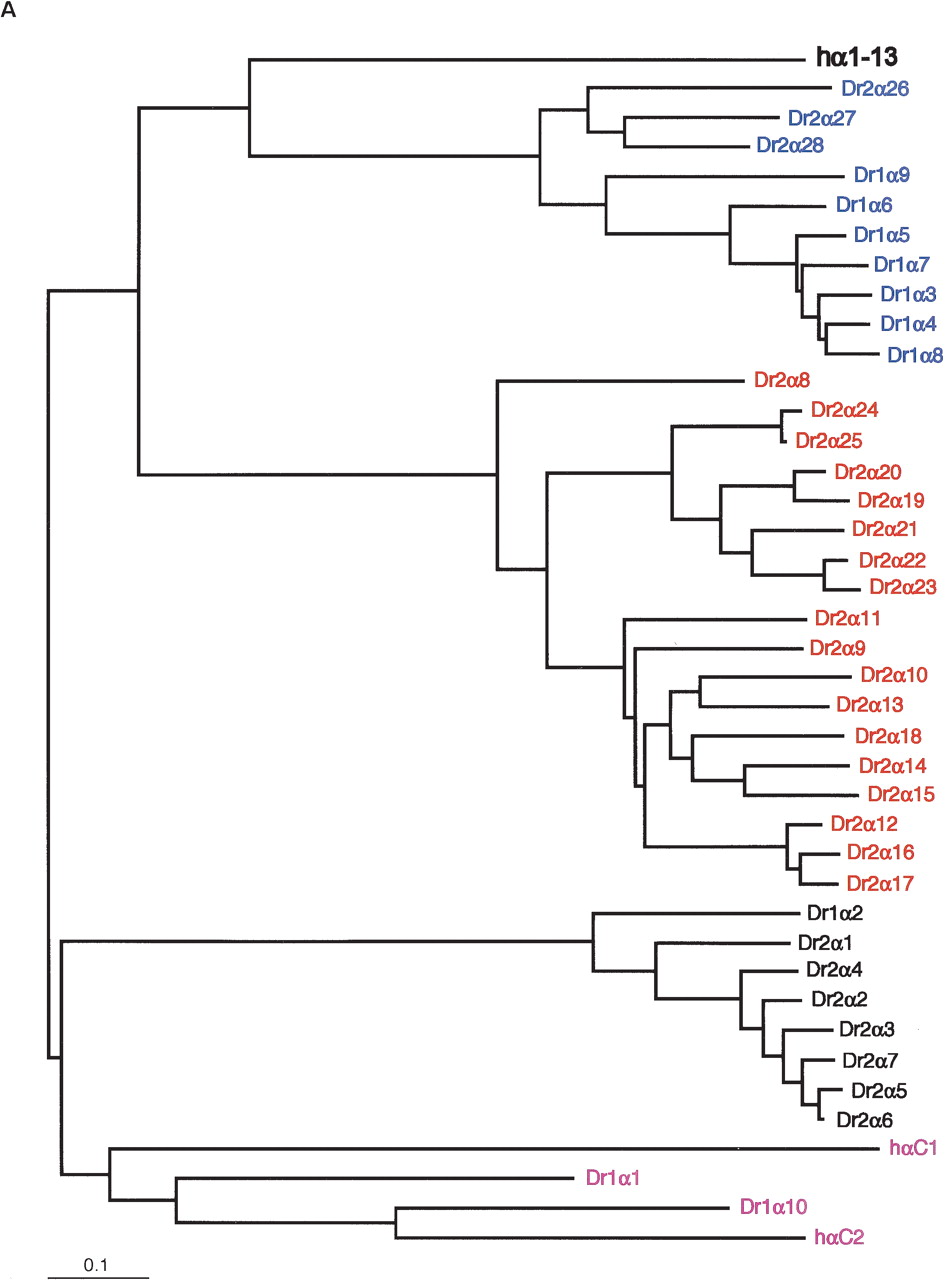
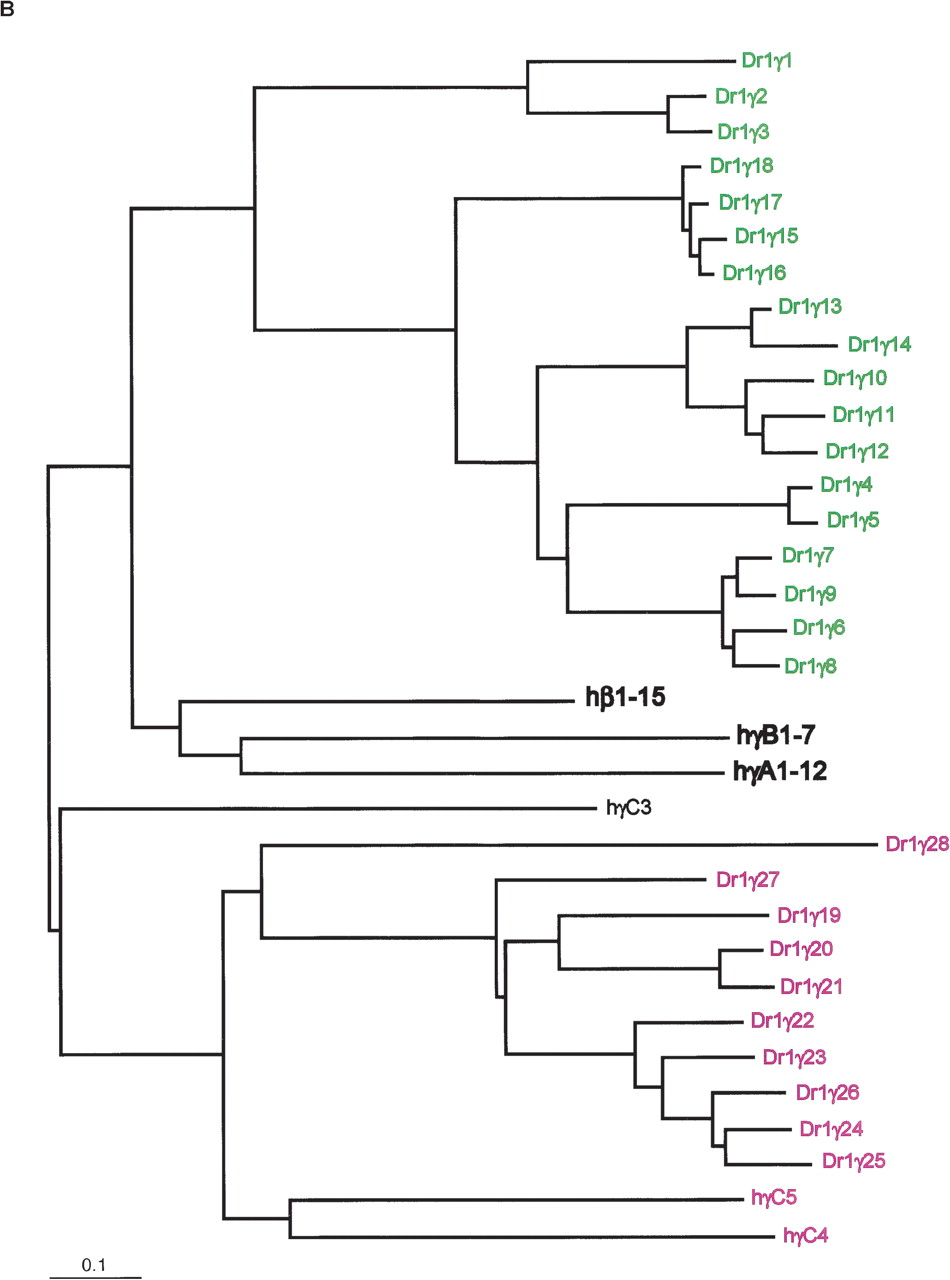
Figure 3
Maximum-likelihood phylogenies of zebrafish and human protocadherin cluster proteins. Members of paralog subgroups are indicated by color as in Figure 1. For clarity, subtrees of human protocadherin subgroups are shown as single branches in each tree, except for human C-type protocadherins, which are shown individually in purple. Trees are rooted by midpoint. (A) Protein tree of DrPcdh1α, DrPcdh2α, and human Pcdhα. (B) Protein tree of DrPcdh1γ, human Pcdhβ, and Pcdhγ.


