
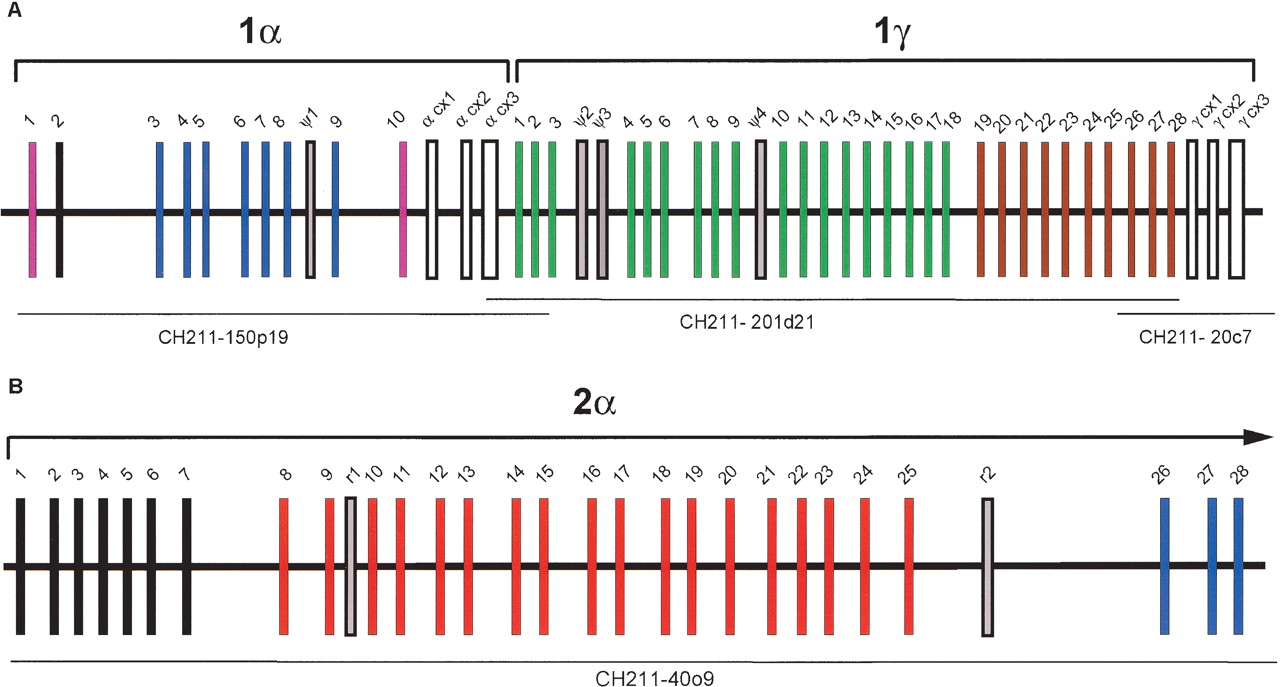
Figure 1
Organization of protocadherin gene clusters in zebrafish. Subgroups of paralogous variable exons are indicated by color. Constant region exons are in white. Pseudogenes (ψ) are in gray. (A) Zebrafish Pcdh1α and Pcdh1γ. (B) Partial zebrafish Pcdh2. Sequenced BAC clone names and their locations are shown below each gene cluster.


