
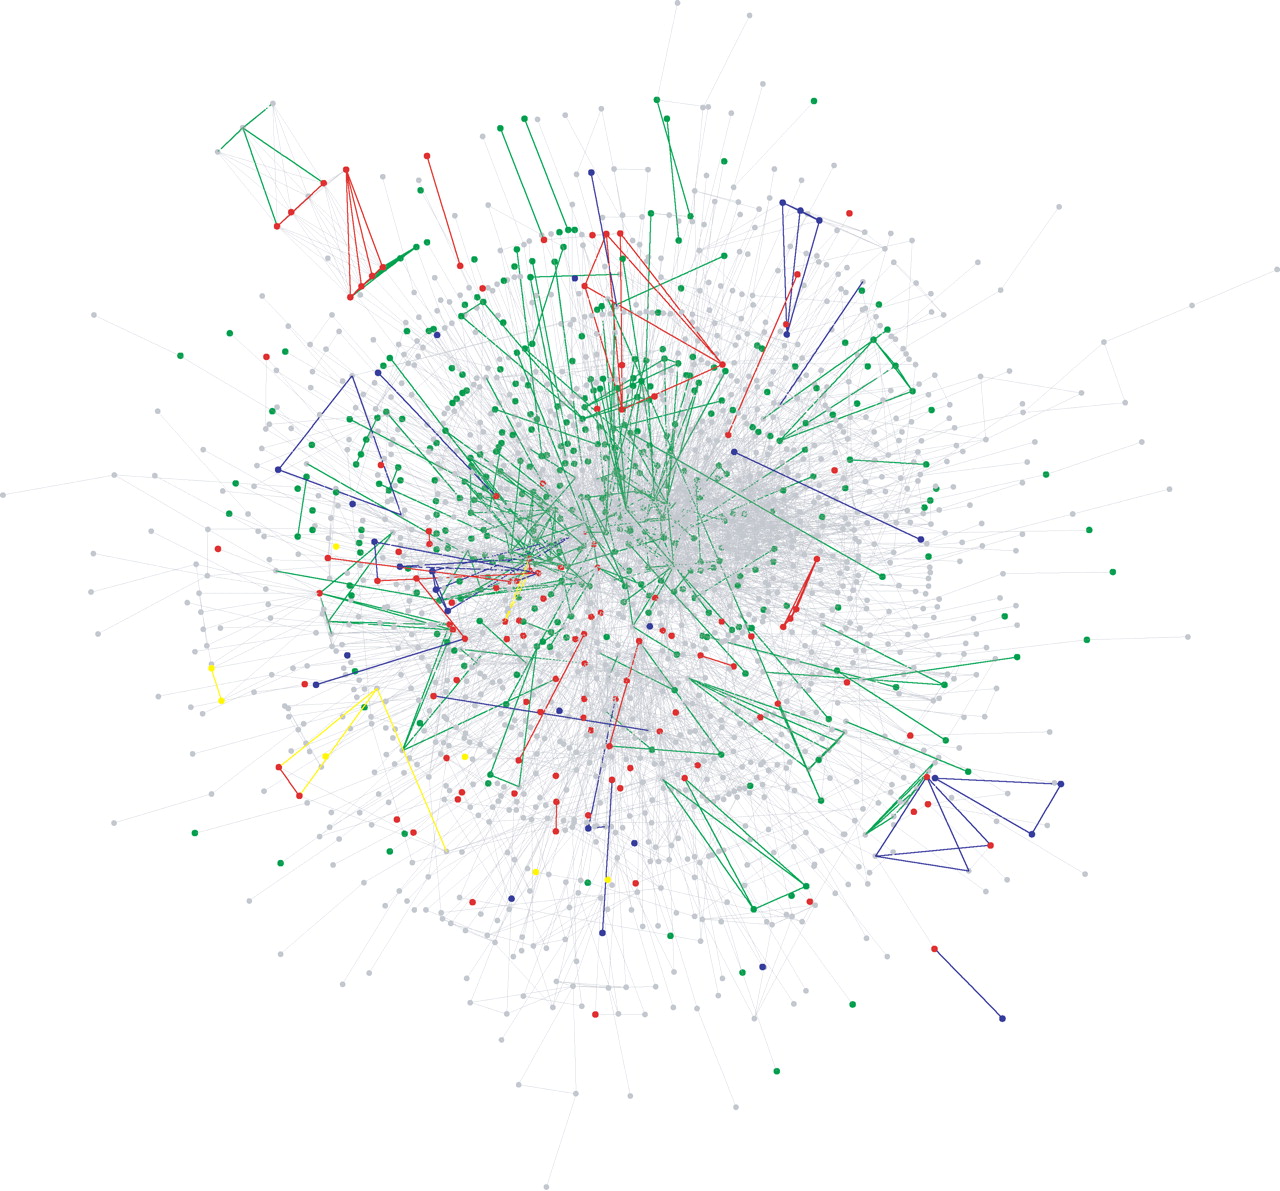
Figure 6
The specific domains and combinations in the domain graph. Archaeal-specific domains and combinations are shown in yellow, bacterial-specific in blue, and eukaryotic-specific in green. The common domains and combinations in all genomes are shown in red. The remaining domains and combinations are shown in gray.


