
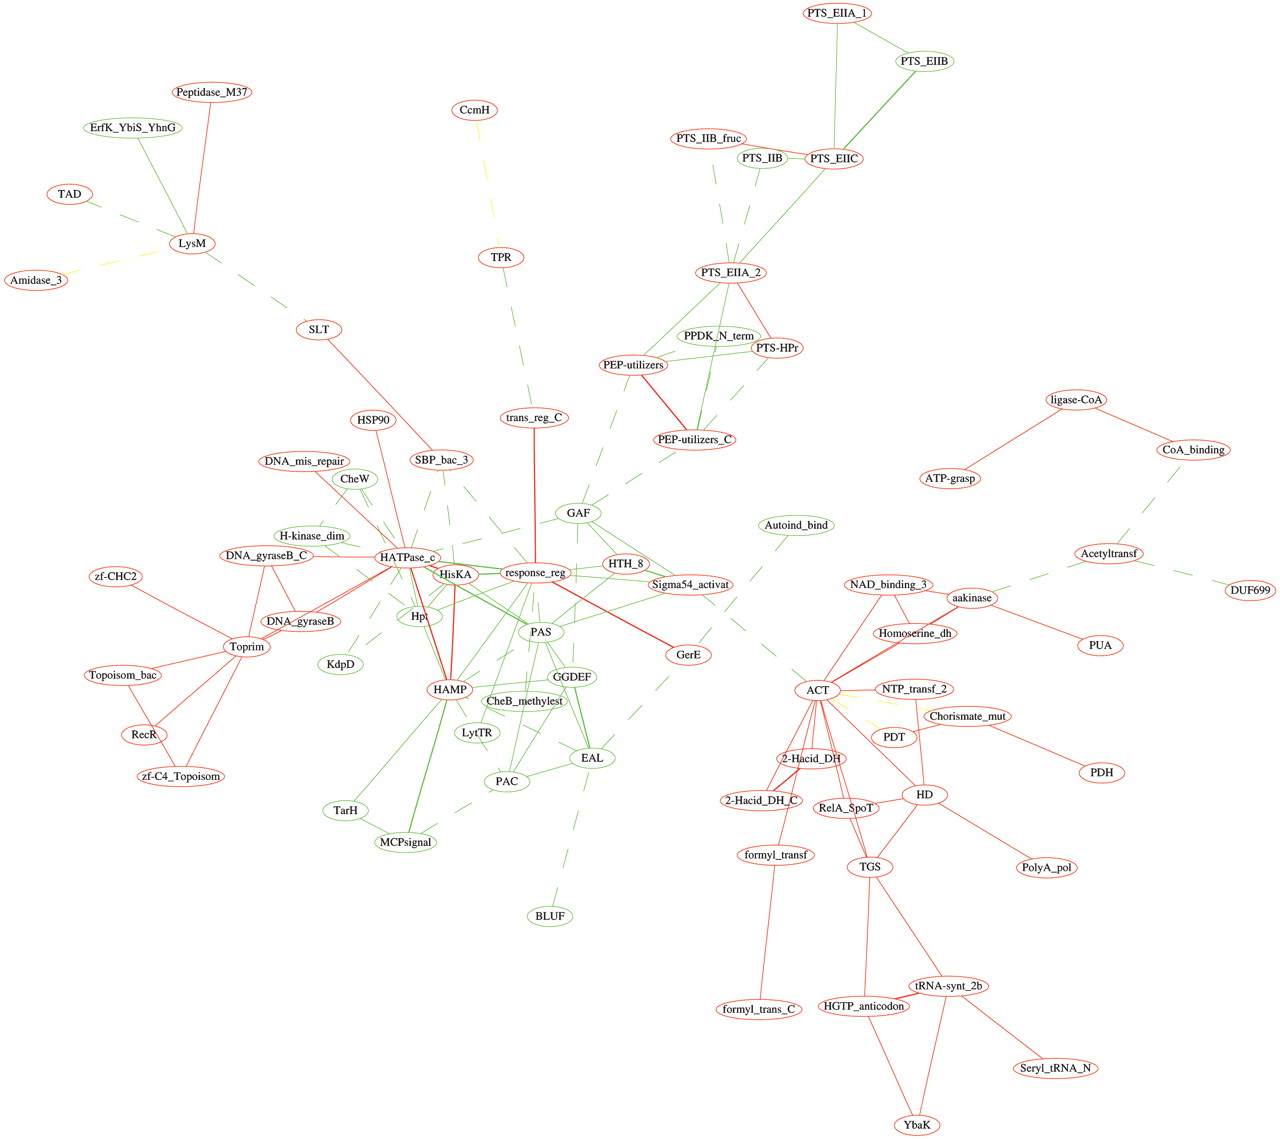
Figure 5
The comparison between the domain graph of Haemophilus influenzae (hin) and that of Escherichia coli K12 (eco). Only the largest component of their “combined” domain graph is shown with the common and specific domain and domain combinations shown in different colors: common in red, hin-specific in yellow, and eco-specific in green. The edges ofweight 1 are shown in dashed lines, others in straight lines. See text for details.


