
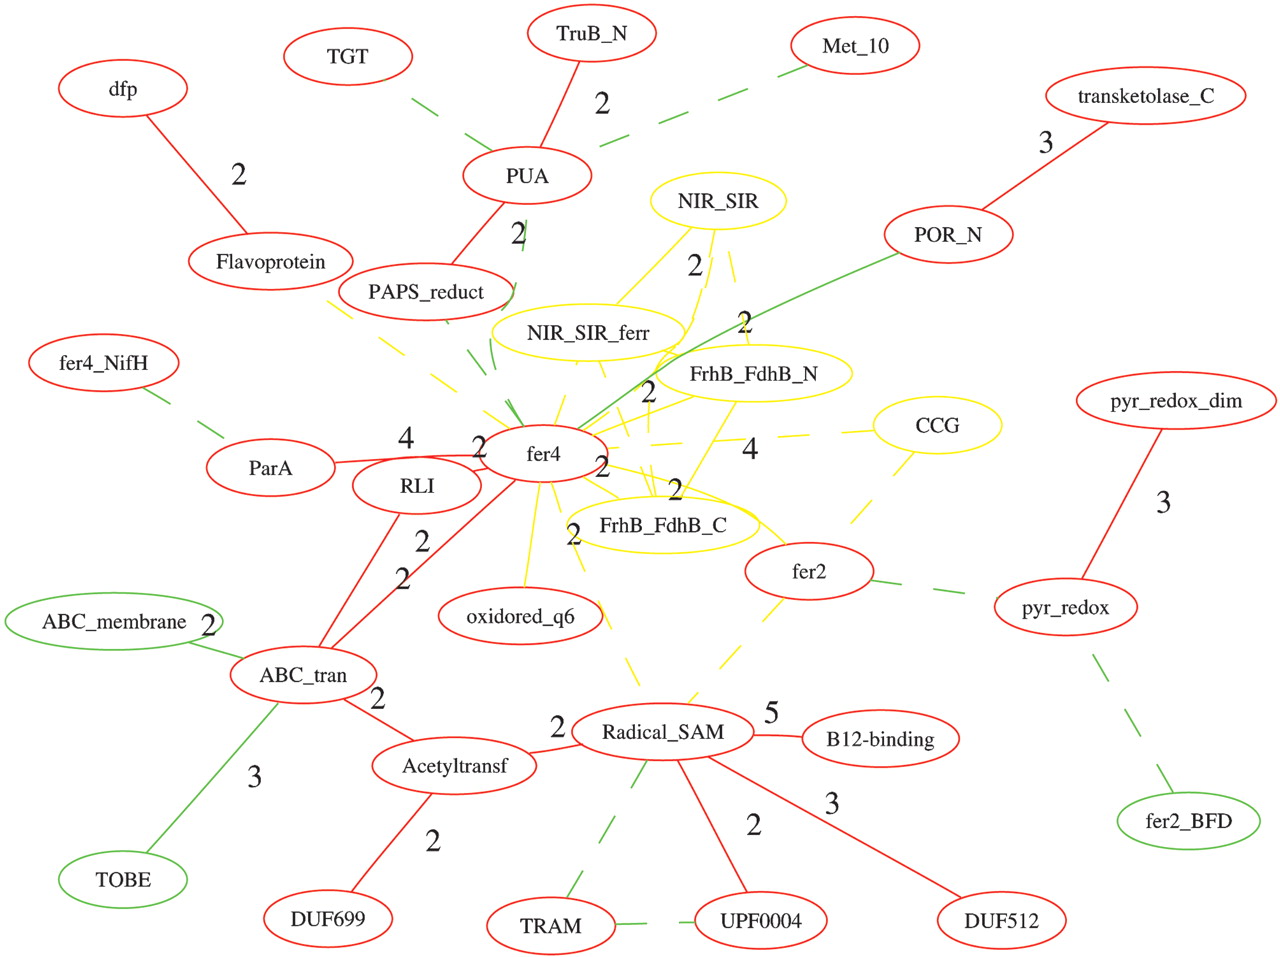
Figure 4
The comparison between the domain graph of Methanopyrus kandleri AV19 (mka) and that of Pyrococcus horikoshii (pho). Only the largest component of their “combined” domain graph is shown with the common and specific domain and domain combinations shown in different colors: common in red, mka-specific in yellow, and pho-specific in green. The edges of weight 1 are shown in dashed lines; otherwise, the weight is shown along with the edges. See text for details.


