
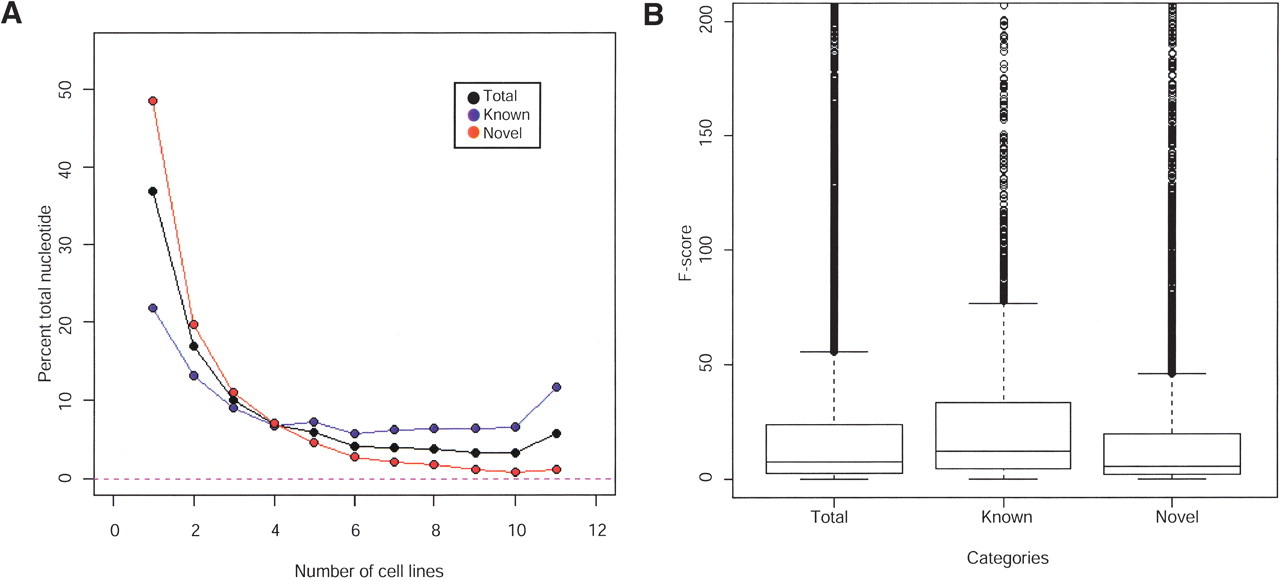
Figure 5
Analysis of the expression and variance of known and novel transcription across all 11 cell lines. (A) Expression of known and novel transcription from 11 cell lines by the percentage of total nucleotides within the total (black), known (blue), and novel (red) transfrags according to the number of cell lines expressing that transfrag. (B) Estimation of the degree of differential expression across the 11 cell lines. An F-statistic was calculated for each transfrag by the variance of the average pseudo-median value in each transfrag between cell lines divided by the average of the within cell line variation of the pseudo-median value in that transfrag.


