
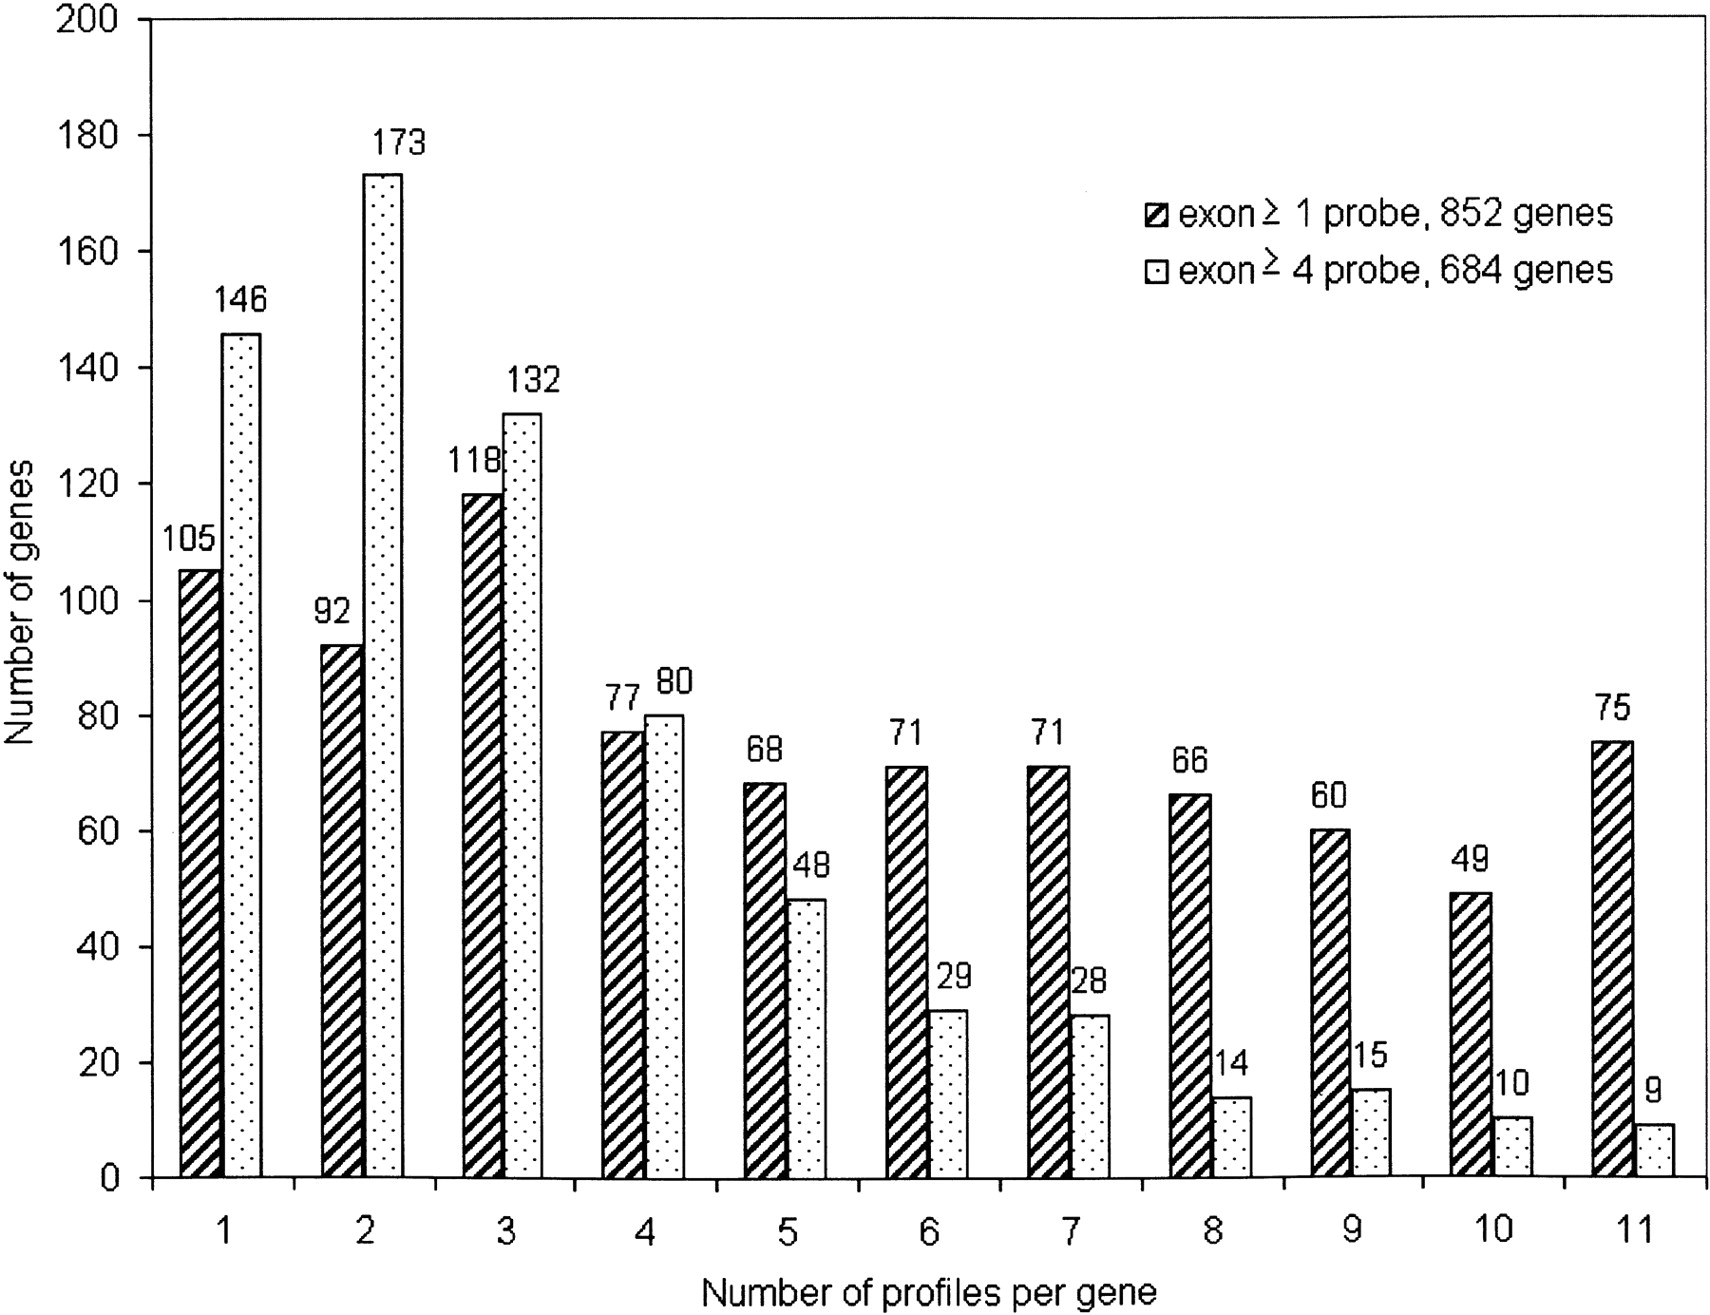
Distribution of genes by isoforms. An “on/off” profile was determined for each exon in all genes on the array. An exon was “on” if at least 30% of the interrogating probe pairs were positive. The histogram shows the count of profiles for each gene in all cell lines. The maximum number of profiles was 11, indicating that a particular gene has a different “on/off” pattern of exons. The minimal number of profiles was 1, indicating that a particular gene has the same “on/off” exon pattern in all 11 cell lines tested. The blue bars represent all exons with at least 30% of the interrogating probe pairs positive. The red bars represent exons that contain four or more interrogating probe pairs with at least 30% of the interrogating probe pairs positive. The numbers above the bars indicate the number of genes that contain the specified number of profiles. Of 852 genes, 75 genes have 11 profiles when considering all exons, and nine genes out of 684 have 11 profiles when considering exons with at least four probes.


