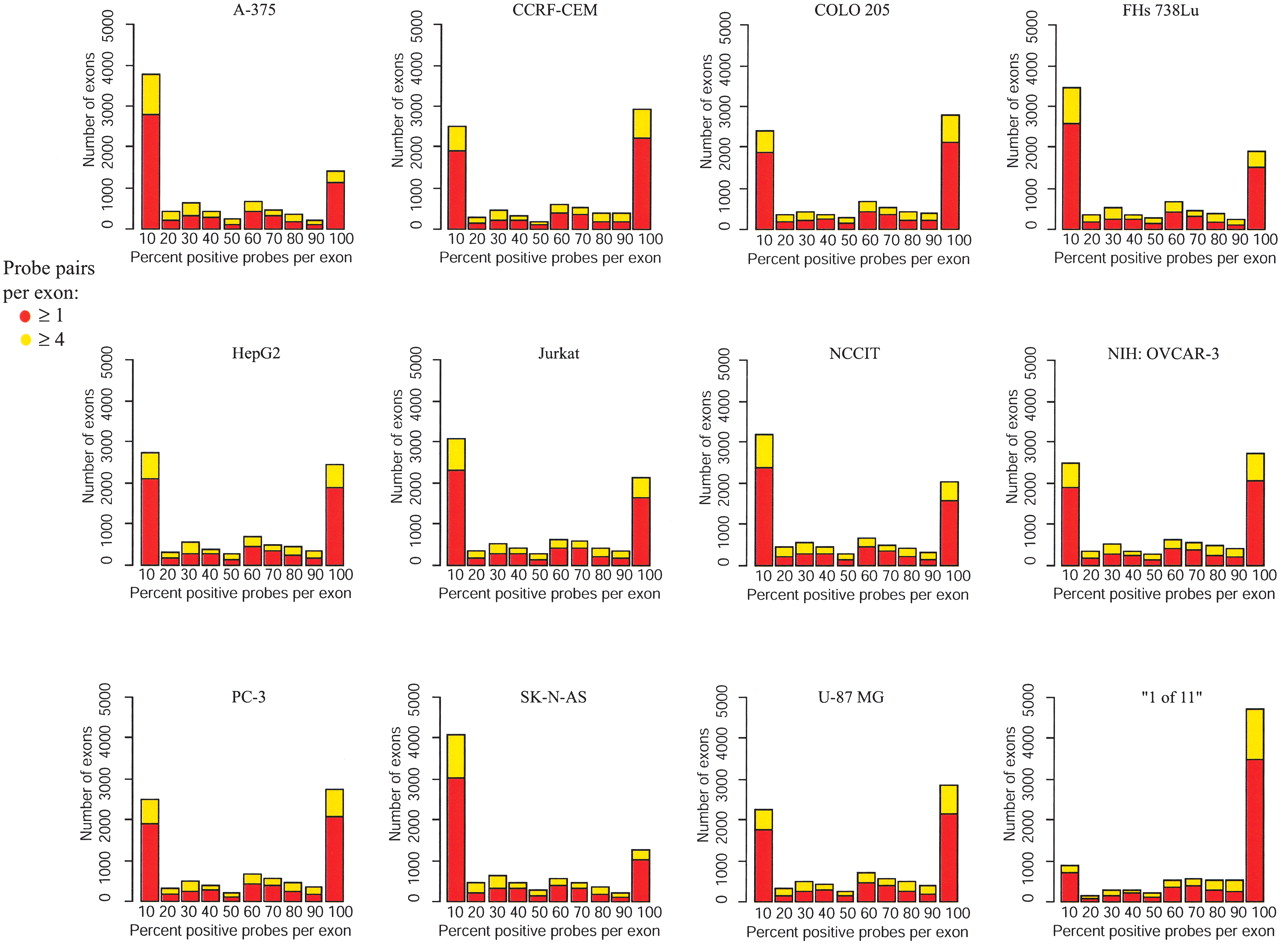
Novel RNAs Identified From an In-Depth Analysis of the Transcriptome of Human Chromosomes 21 and 22

(Downloading may take up to 30 seconds. If the slide opens in your browser, select File -> Save As to save it.)

Click on image to view larger version.

Figure 3
Figure 3

Distribution of positive probes in exons. The distribution of the percent of positive probes in exons is plotted by cell line as well as for the “1 of 11” map. The red bars represent all interrogated exons, and the yellow bars represent exons that contain four more interrogating probe pairs.

This Article

  1. Genome Res. 14: 331-342

Preprint Server