
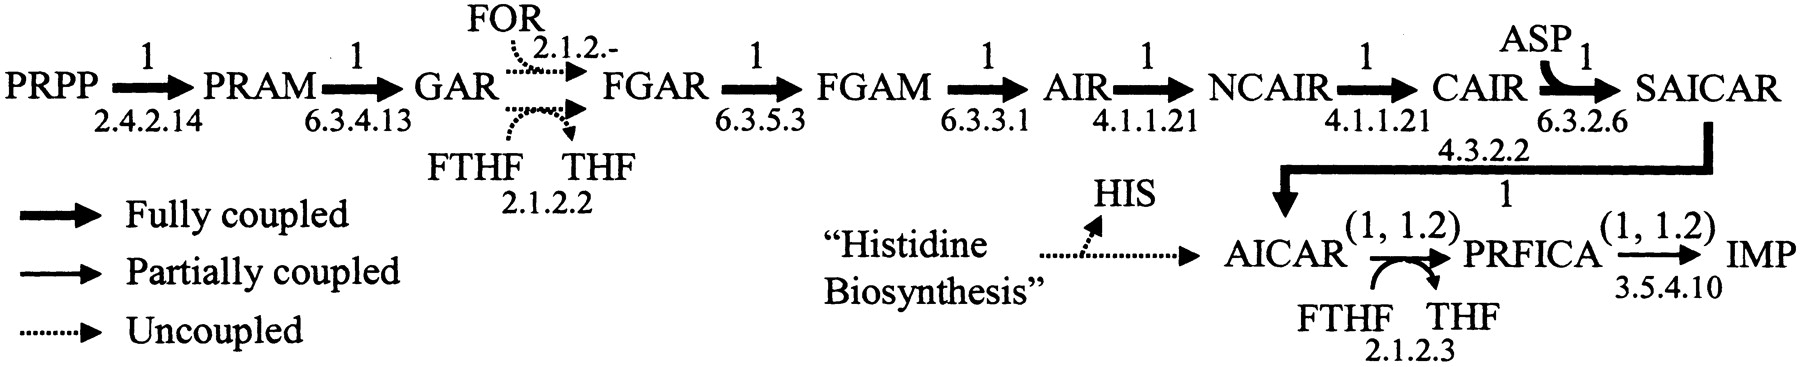
Figure 6
Coupled reaction set identified for purine biosynthesis in E. coli on a glucose-minimal medium, assuming a constant biomass composition. The numbers indicate the relative values or range of values for each flux in any particular flux distribution for given growth condition. Secondary metabolites and cofactors are omitted for simplicity.


