
Figure 10
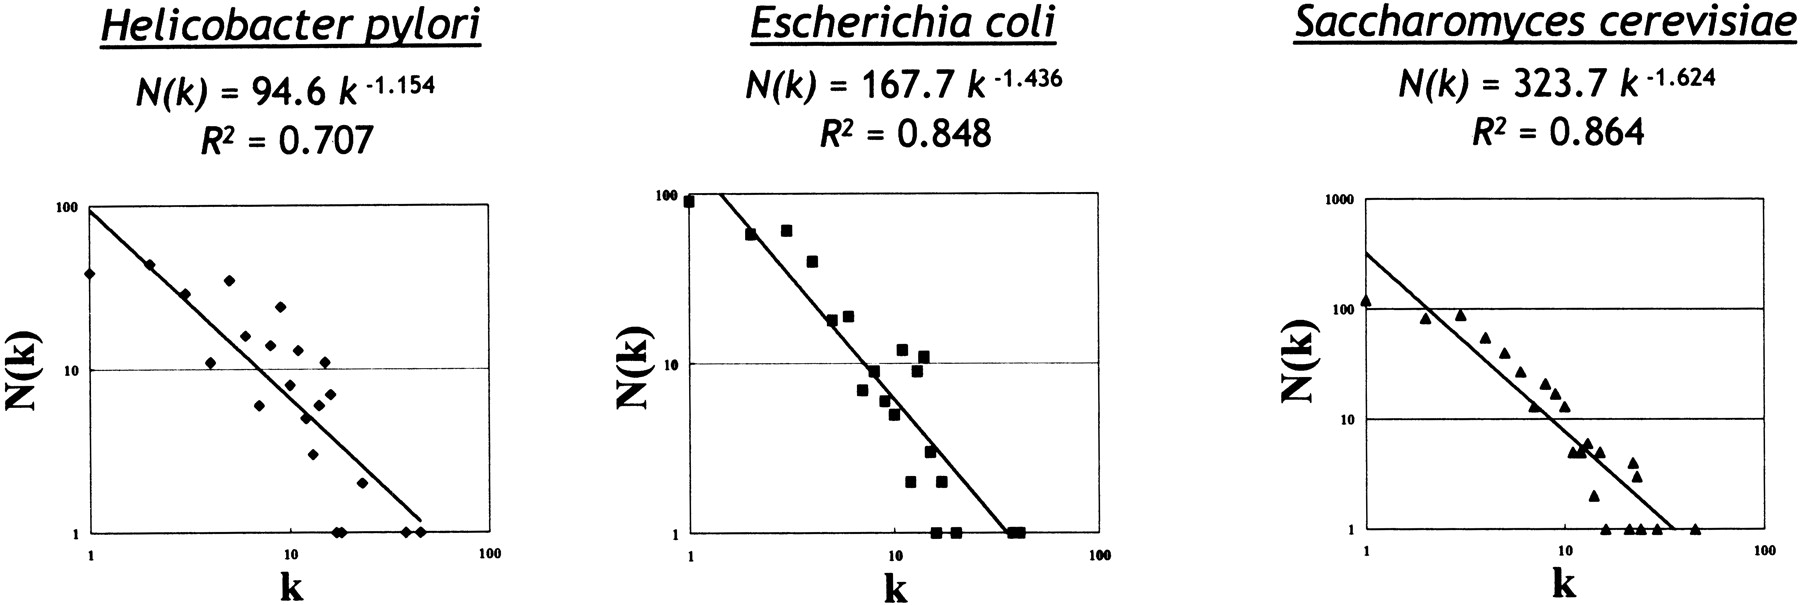
The number of reactions N(k) implying k other reactions are plotted as a function of k for H. pylori, E. coli, and S. cerevisiae growth on a glucose-minimal medium.
(Downloading may take up to 30 seconds. If the slide opens in your browser, select File -> Save As to save it.)
Click on image to view larger version.
The number of reactions N(k) implying k other reactions are plotted as a function of k for H. pylori, E. coli, and S. cerevisiae growth on a glucose-minimal medium.
 CiteULike
 Delicious
 Digg
Digg Facebook
 Google+
 Reddit
 Twitter
