
Figure 3
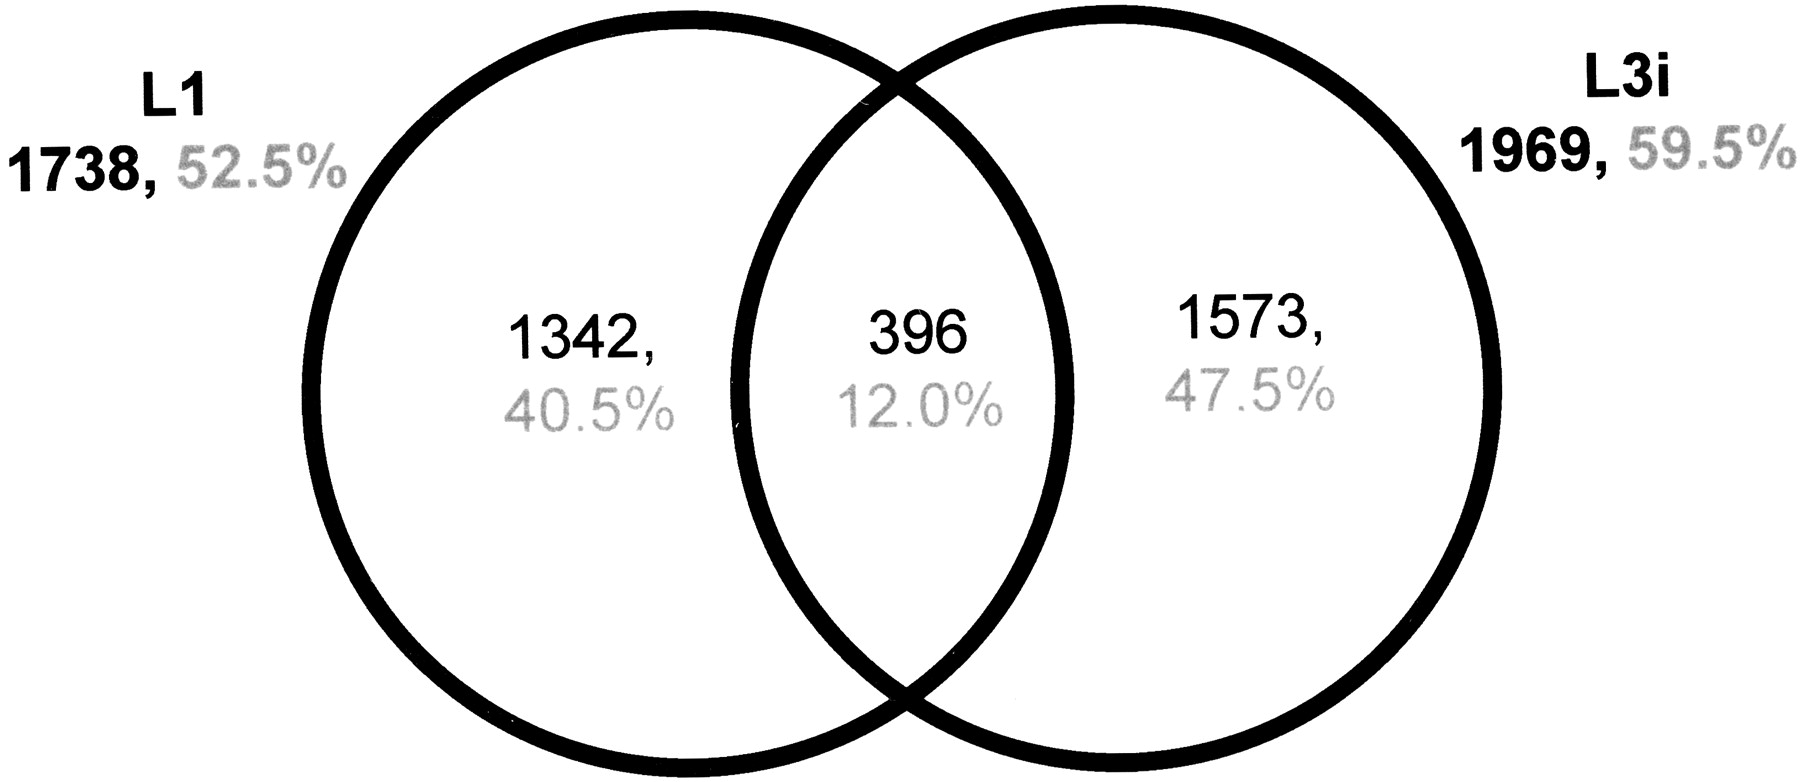
Venn diagram showing distribution of S. stercoralis clusters based on library of origin of each cluster's EST members. The majority of clusters are either L1-specific or L3i-specific.
(Downloading may take up to 30 seconds. If the slide opens in your browser, select File -> Save As to save it.)
Click on image to view larger version.
Venn diagram showing distribution of S. stercoralis clusters based on library of origin of each cluster's EST members. The majority of clusters are either L1-specific or L3i-specific.
 CiteULike
 Delicious
 Digg
Digg Facebook
 Google+
 Reddit
 Twitter
