
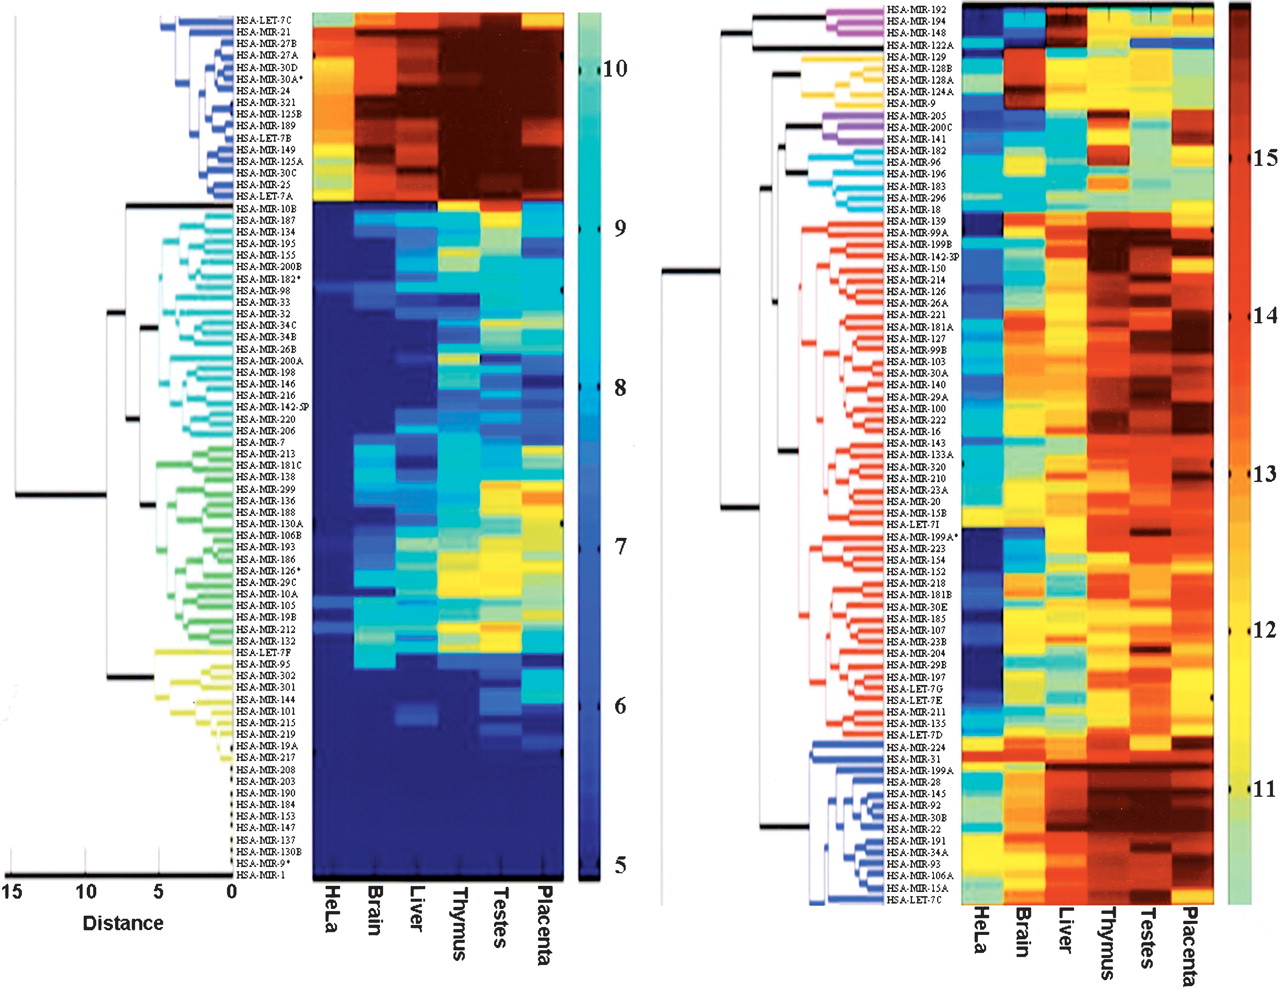
Clustering analysis of the expression of 150 human MIRs in placenta, testes, thymus, liver, brain, and HeLa cells. The clustering procedure used to derive the dendrogram is described in the Methods section. The level of expression of each MIR in each of the samples is indicated by the color shown next to the MIR name. The relationship between the color and the expression levels is defined by the color key on the right side of the figure. The color code numbers on the color key are log2 of the signal intensity. The original figure was cut in half due to space considerations. HSA-LET-7c, found in the bottom, right, and at top, left, links the two halves.


