
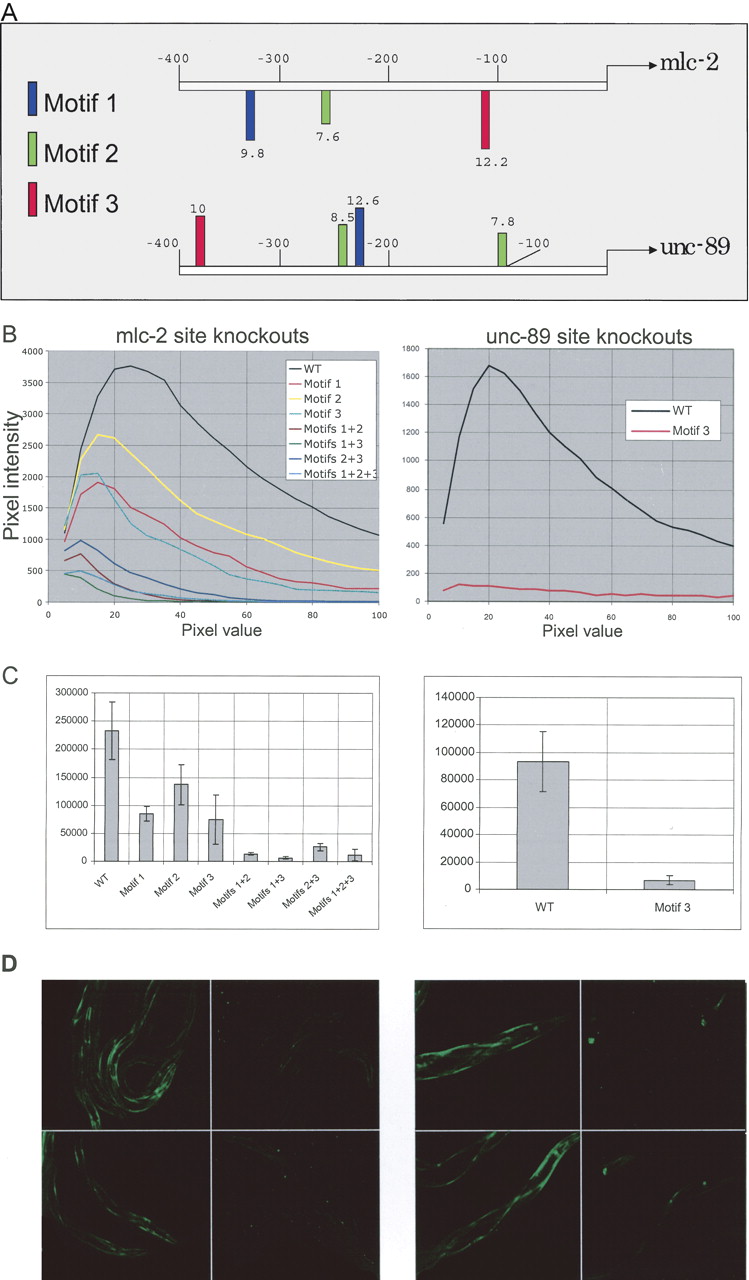
(A) Location of predicted sites corresponding to motifs 1, 2, and 3 in the immediate upstream region of genes mlc-2 and unc-89. Sites on the reverse strand are shown below the sequence line. The numbers above or below each site indicate the site score given by the PATSER program upon alignment of the matrix to a sequence. (B–D, left) mlc-2 Expression; (B–D, right) unc-89 expressions. (B) GFP intensity vs. pixel measurements for wild-type and different site knockouts in the promoters of mlc-2 and unc-89 genes. Data from one line and one photograph is shown for each of the constructs. (C) Total intensity measurements for wild-type and different site knockouts for the mlc-2 and unc-89 gene promoters. The GFP intensity data for the wild-type and different knockouts were obtained from a minimum of 11 animals in case of mlc-2 and 30 animals for unc-89. Three different lines were generated for mlc-2 wild type, mlc-2 motif 2 knockout, mlc-2 motif knockouts 1+2+3, unc-89 wild type, and unc-89 motif 3 knockout. In all other cases, one line was used. (D) GFP expression photographs with wild-type mlc-2 promoter::GFP construct and with the triple knockout (motifs 1, 2, and 3 eliminated), and GFP expression with wild-type unc-89 promoter::GFP construct and with the knockout of motif 3 site. The left two panels of each figure are the photographs of wild-type proteins, while the right panels give the site knock-outs.


