
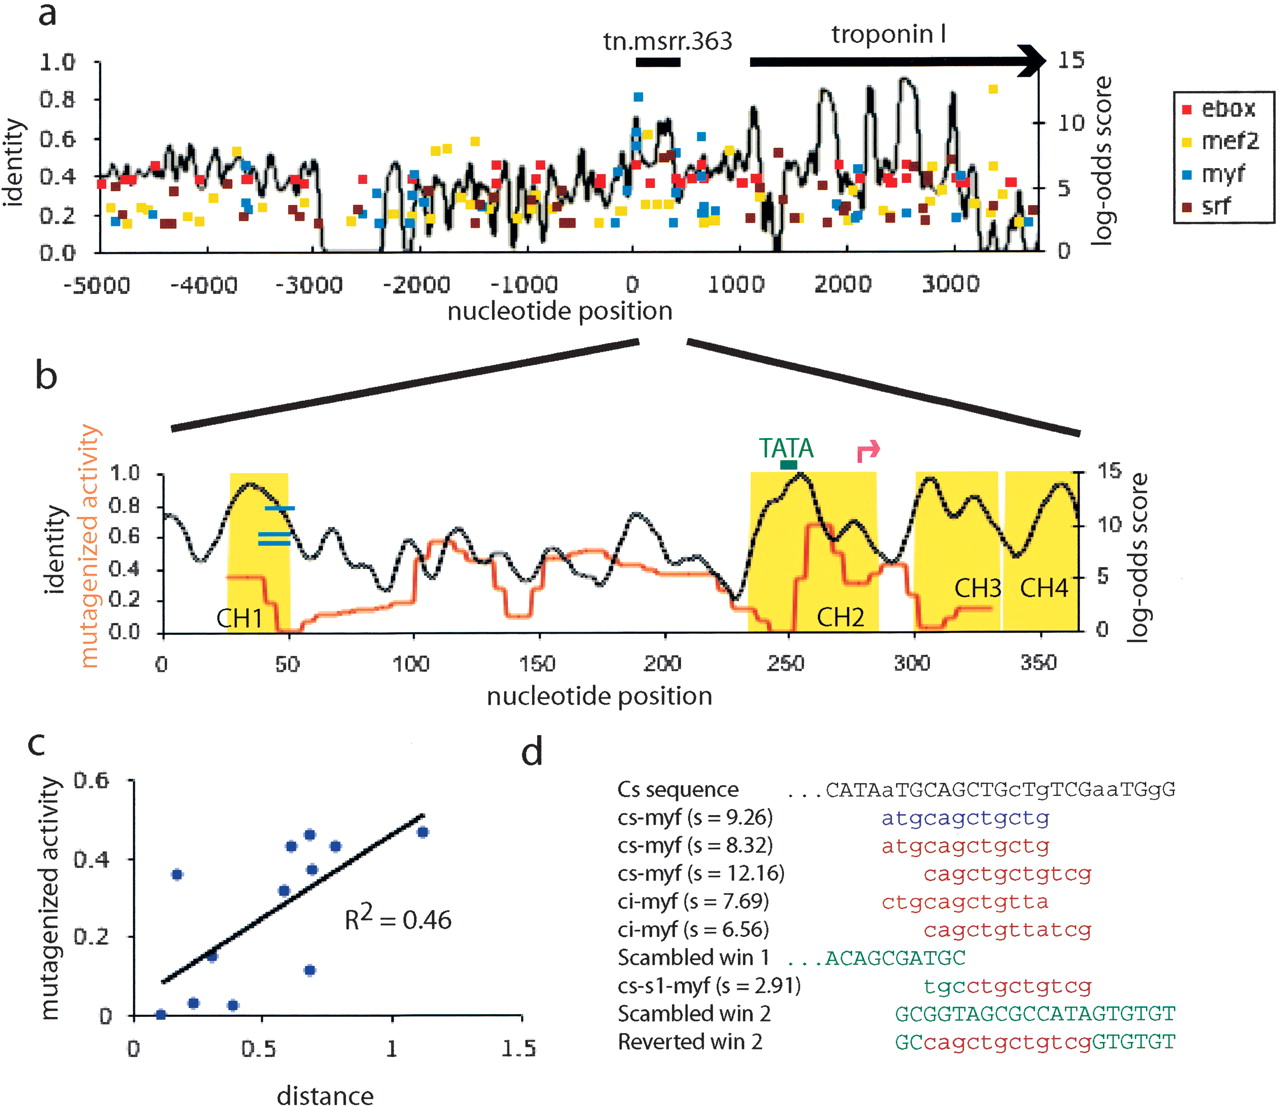
Conservation, predicted binding sites, and activity upon mutagenesis in the TnMSRR. (a) Plot of predicted binding sites for four common vertebrate muscle regulators for the TnI locus. The right y-axis shows the log-odds score of the site. The black line plots sequence identity (left y-axis) between C. savignyi and C. intestinalis. The location of the enhancer (tn.msrr.363) is shown. (b) Plot of conservation versus activity upon mutagenesis, with predicted binding sites. The left y-axis is sequence identity (black) and activity on mutagenesis (red), and the right y-axis is the log-odds score of predicted sites. The black line plots sequence identity between the C. savignyi and C. intestinalis enhancers. The red line represents the activity (number of embryos staining/total embryos) of the lacZ reporter when a 20-bp window spanning that position is randomized. The yellow shading represents CHAOS hits, the green line is a conserved TATA-box, the pink arrow is the predicted transcription start site, and the blue lines are the three myf predictions. (c) Scatterplot of activity upon mutagenesis versus distance. The distance within each 20-mer is calculated by Kimura's two-parameter model. Mutagenized windows with activity >50% are not included, nor are poorly aligned sequences. (d) Predicted myf sites in C. savignyi and C. intestinalis, aligned with the two relevant scrambled windows. A predicted site remains in scrambled window 1, which retains activity, and no sites are predicted in scrambled window 2, which disrupts activity. Reverting one of the predicted sites back to wild type restores function (reverted window 2). Sequence of C. savignyi (Cs) is shown on top, with capital letters indicating identity with C. intestinalis. Blue sites are predicted on the forward strand, red sites on the reverse. All images and sequences are archived for retrieval at http://mendel.stanford.edu/supplementarydata/johnson.


