
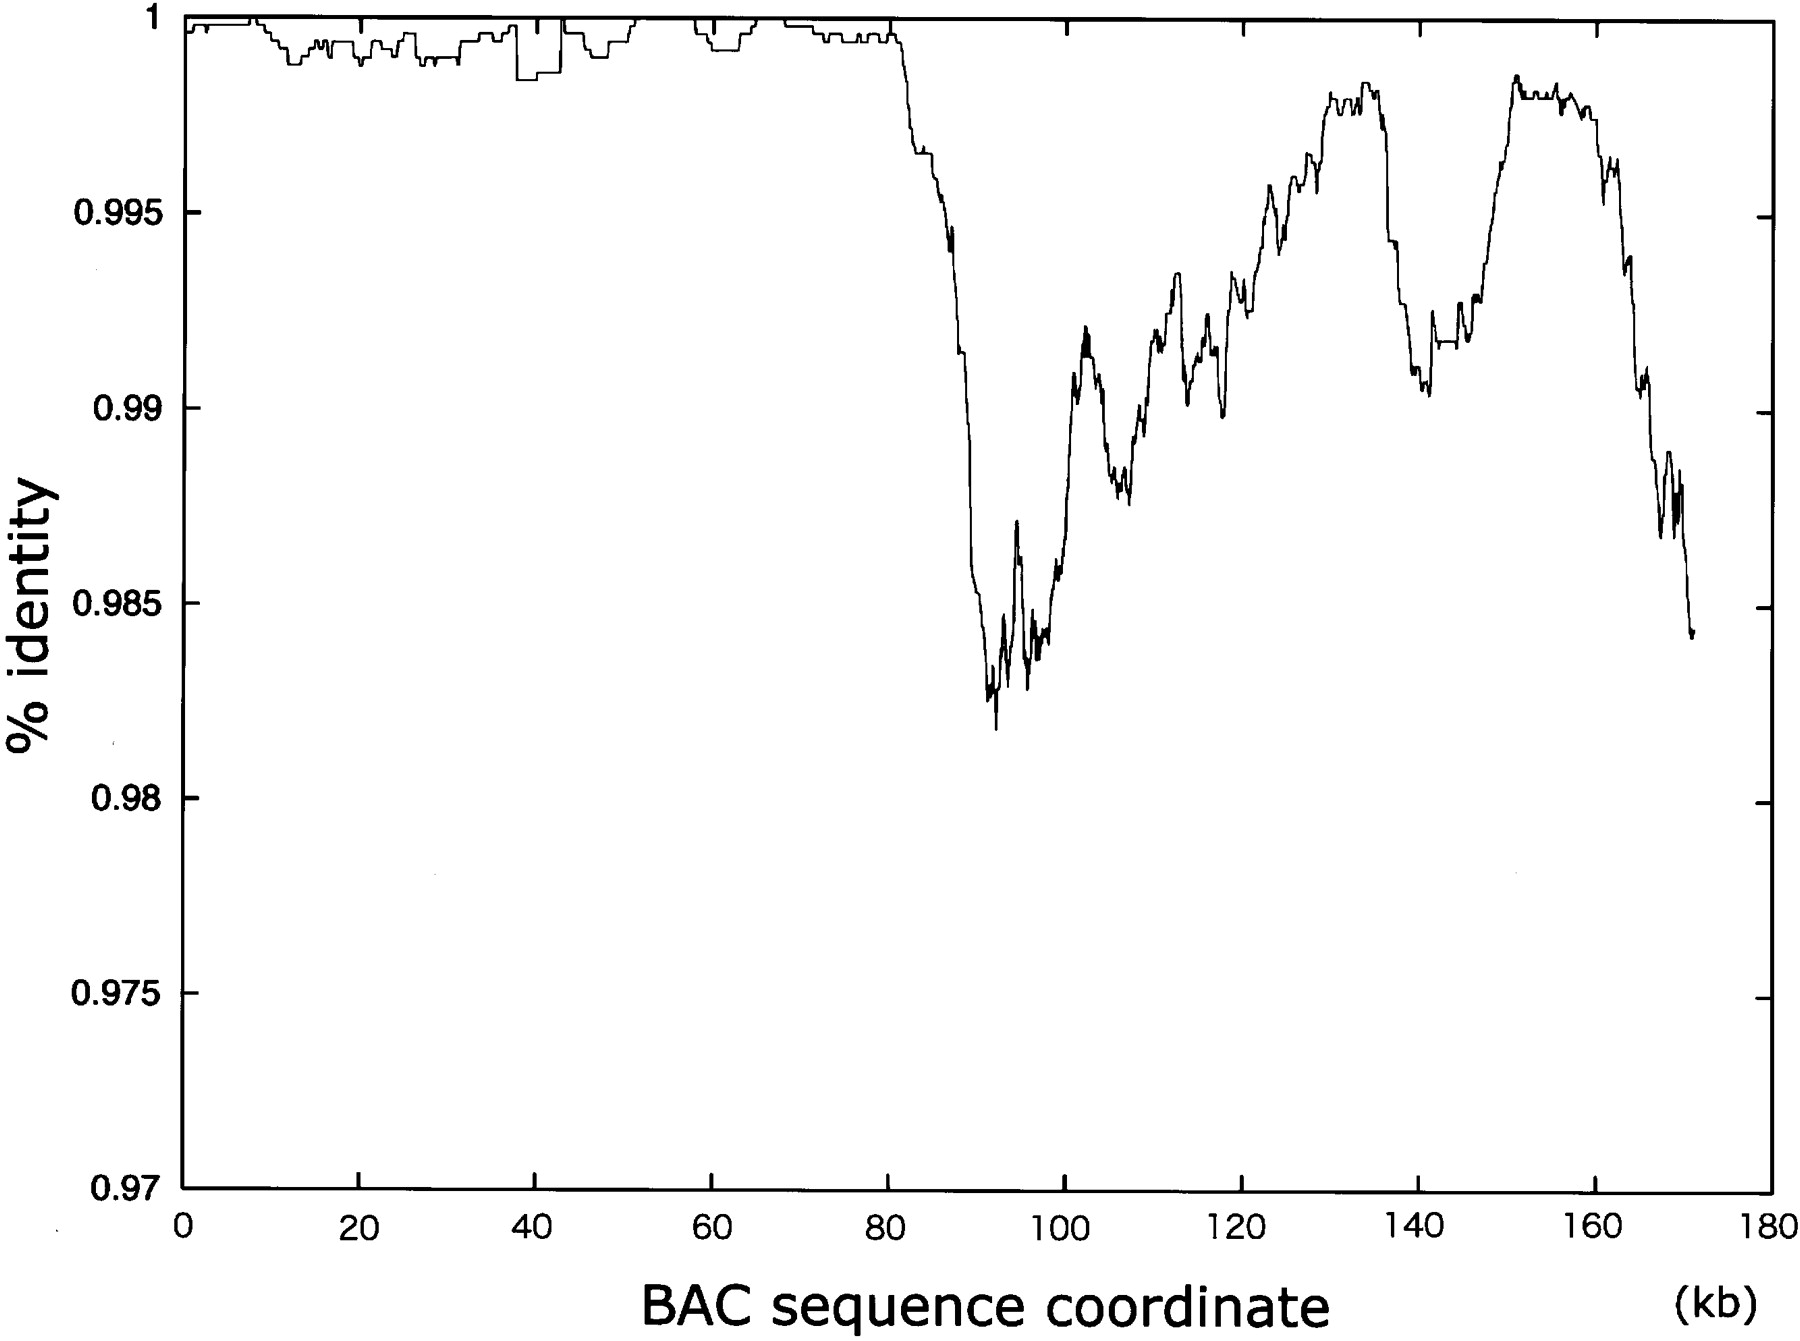
Figure 4.
SNP distribution within the BAC clone MSMg01-122K03, on the border of low-to-high SNP regions. MSMg01-122K03 is mapped at chr1_156195129–156370415, which is on the border of low-to-high SNP transition. Complete sequence of this clone was determined, compared with the B6 sequences, and % identity (y-axis) was plotted along the entire sequence (x-axis).


