
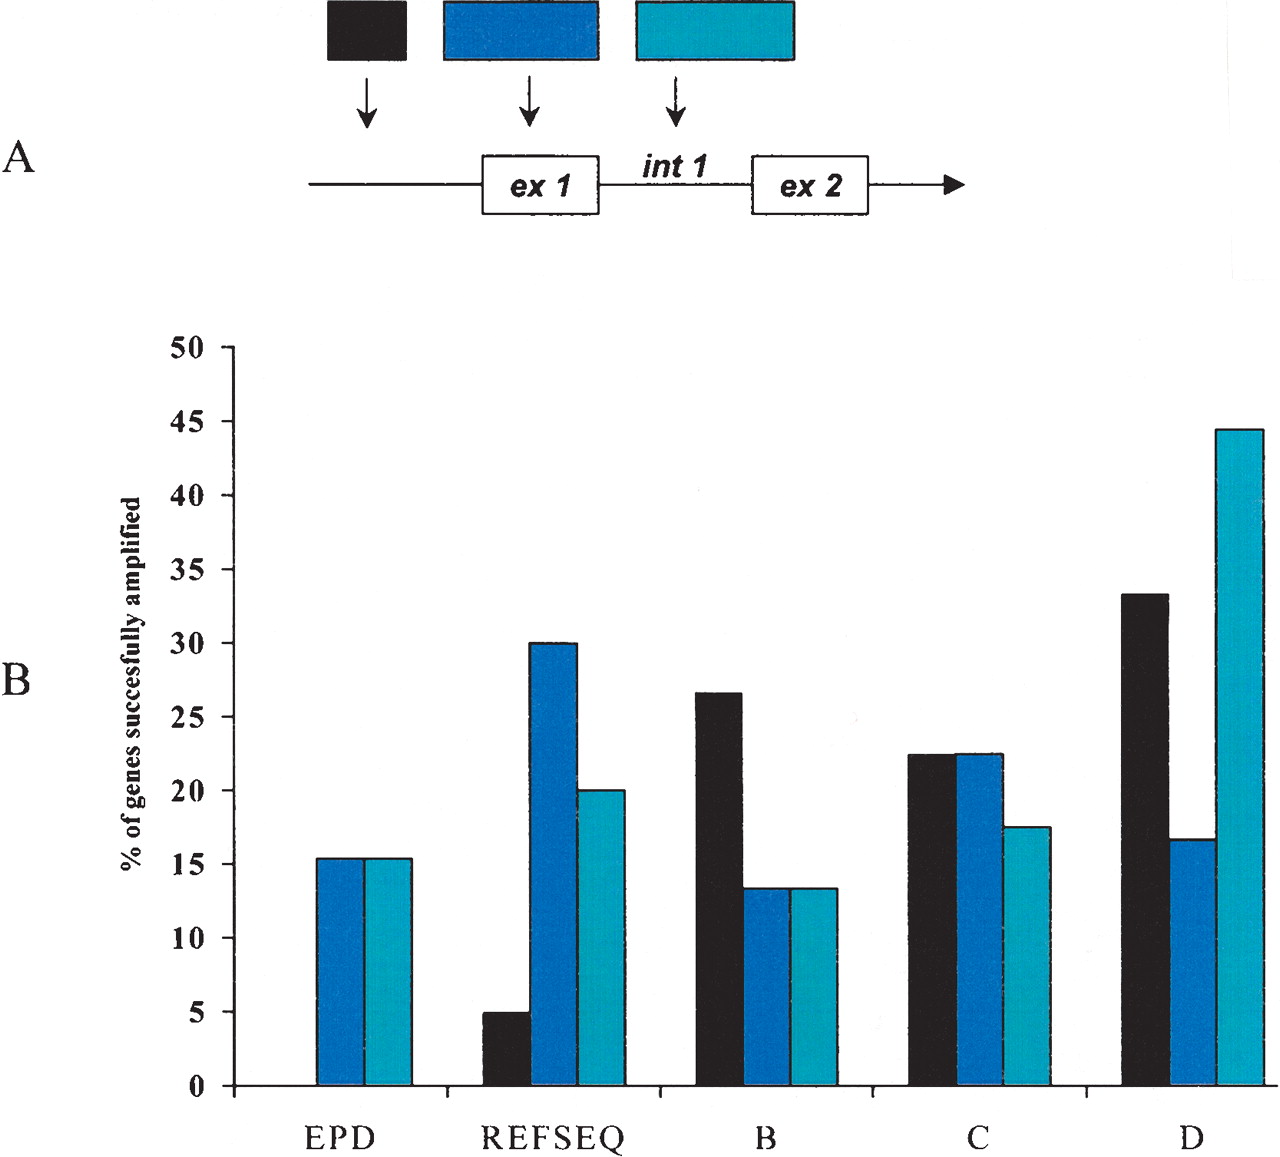
Figure 1.
Comparison of current 5′ annotation with 5′ RACE–PCR results. (A) Schematic representation of the possible alignments of the first exon suggested by 5′ RACE sequence relative to the annotated exons (ex) and introns (int). (B) Percentage of genes detected in each category whose 5′ RACE sequence exhibits the alignments as follows: first exon is upstream of the annotated first exon (black), first exon overlaps with annotated first exon but extends it by at least 20 bp (blue), and first exon lies completely in the annotated first intronic region or aligns to the second annotated exon and extends into the first intronic region (light blue).


