
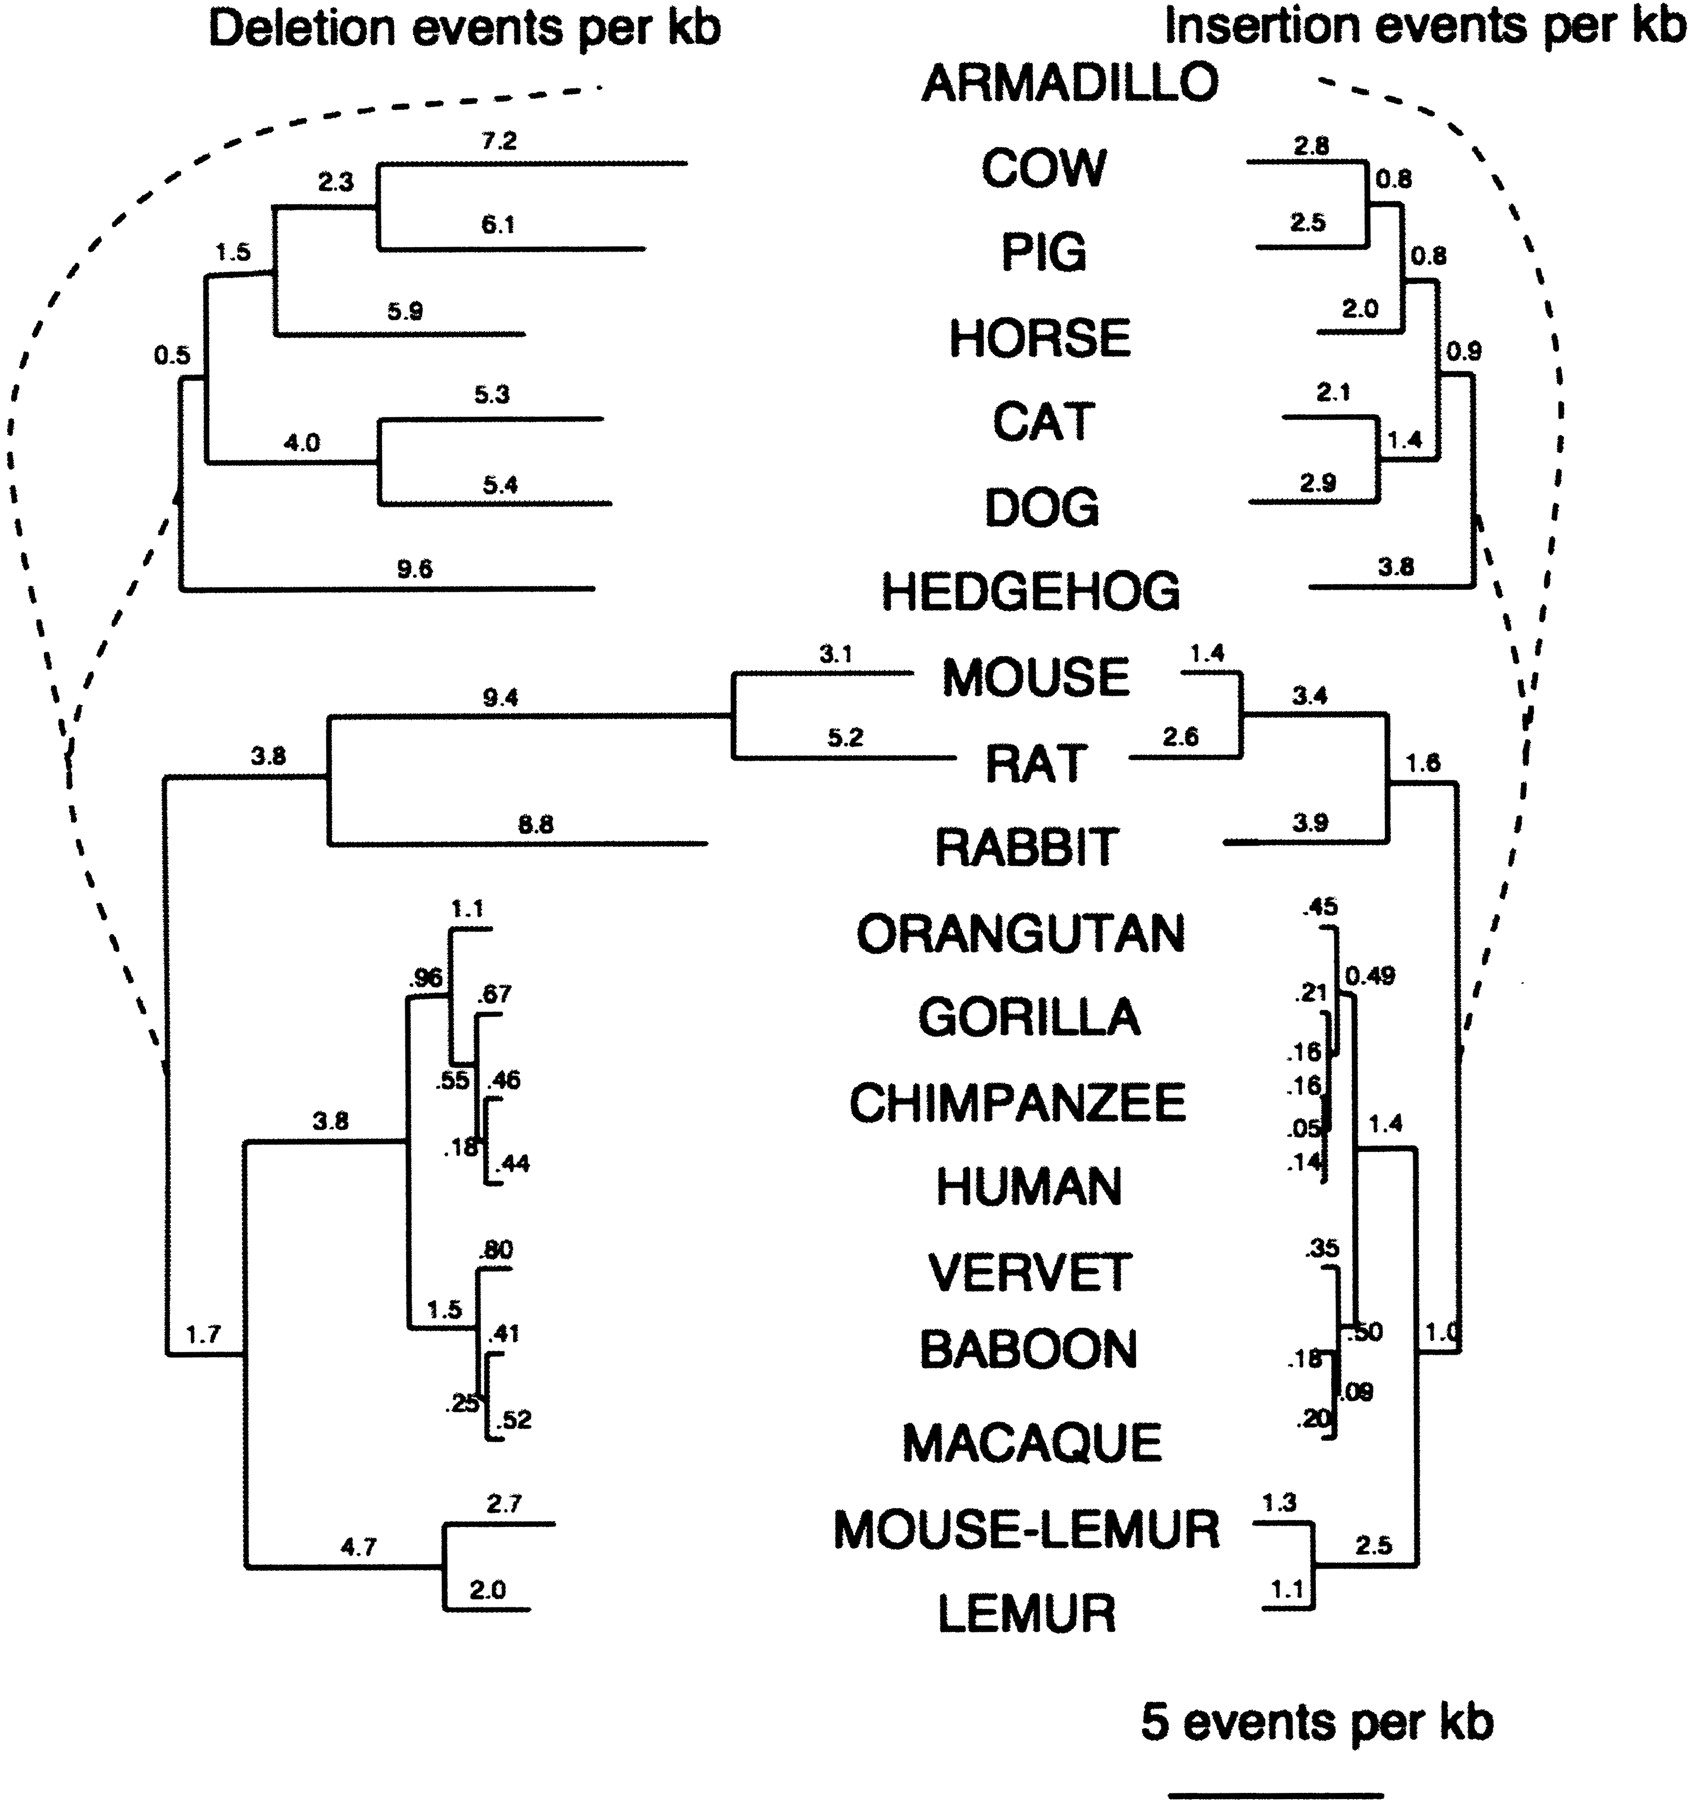
Figure 5.
Frequency of microdeletions (1–10 bp) (left) and microinsertions (right) during eutherian evolution. Indel rates for the branches shown with dashed lines cannot be accurately estimated. Estimates are based on a set of regions totaling about 280 kb, for which sequence data is available for all 19 mammals.


