
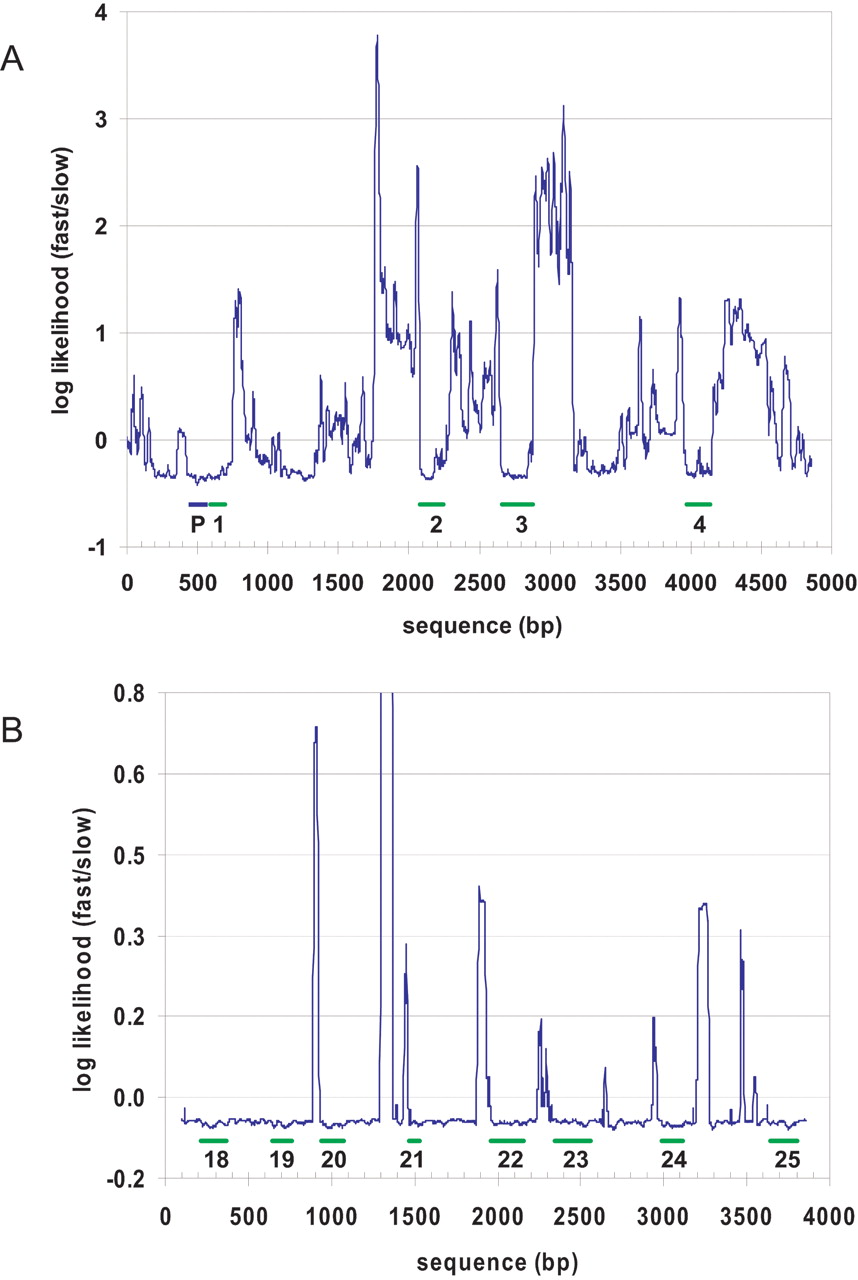
Figure 4.
Mutation rate analysis of the genomic interval containing the 5′ region of the col5a1 (A) and patched (B) genes. The plot was drawn as described in the Figure 2 legend. The sequence of 36 and 22 individuals was used to generate the col5a1 and patched plots (total tree lengths were 0.69 and 0.10), respectively. The blue bar labeled “P” indicates the position of col5a1's promoter; the numbered green bars indicate the position of exons 1–4 of col5a1 and exons 18–25 of patched.


