
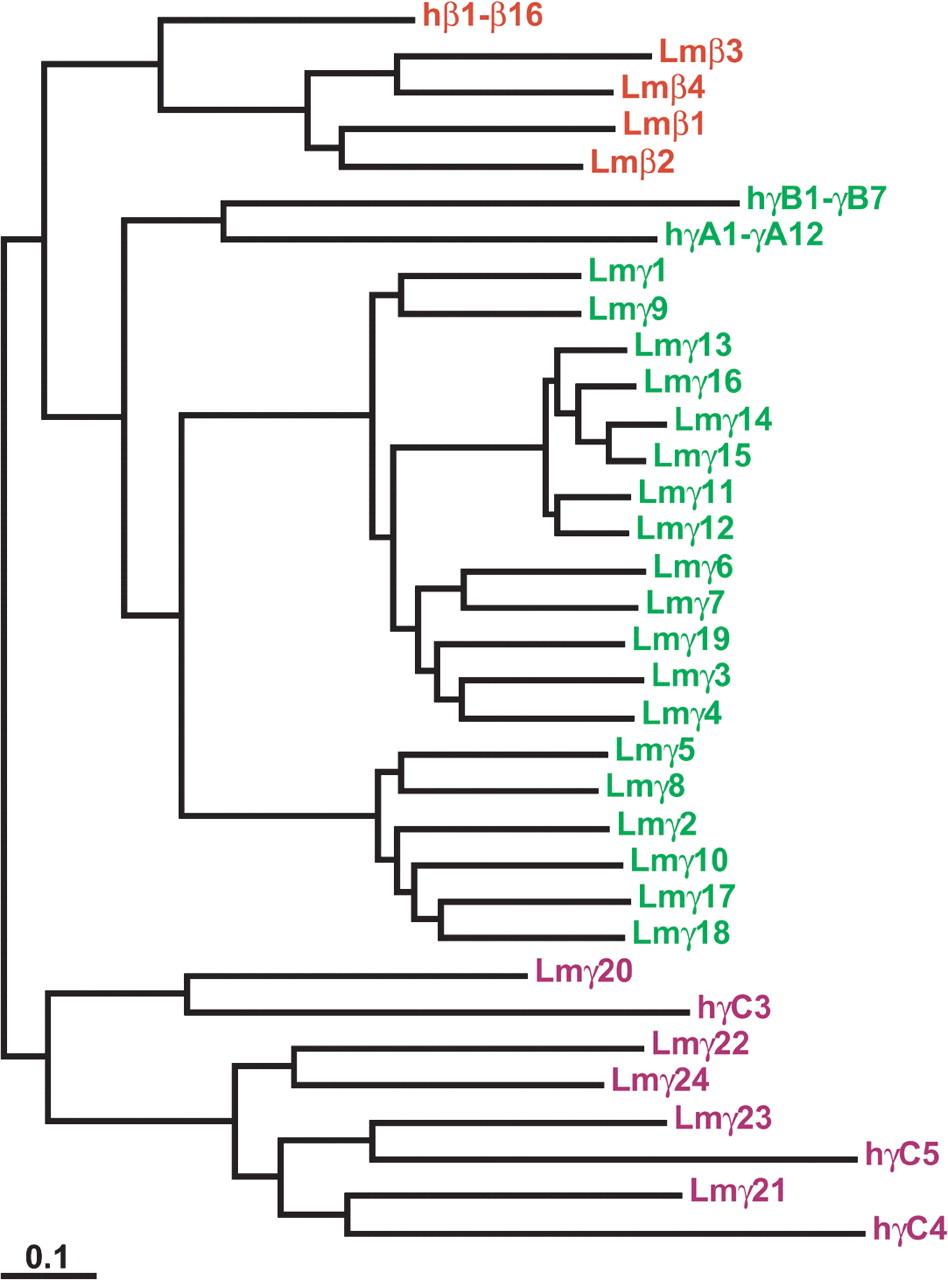
Figure 3.
Maximum likelihood phylogeny of coelacanth and human protocadherin β and γ proteins. Colors indicate paralog subgroups as shown in Figure 1. The subtrees of human Pcdhβ1-β16, PcdhγA1-γA12, and PcdhγB1-γB7 are shown collapsed for clarity.


