
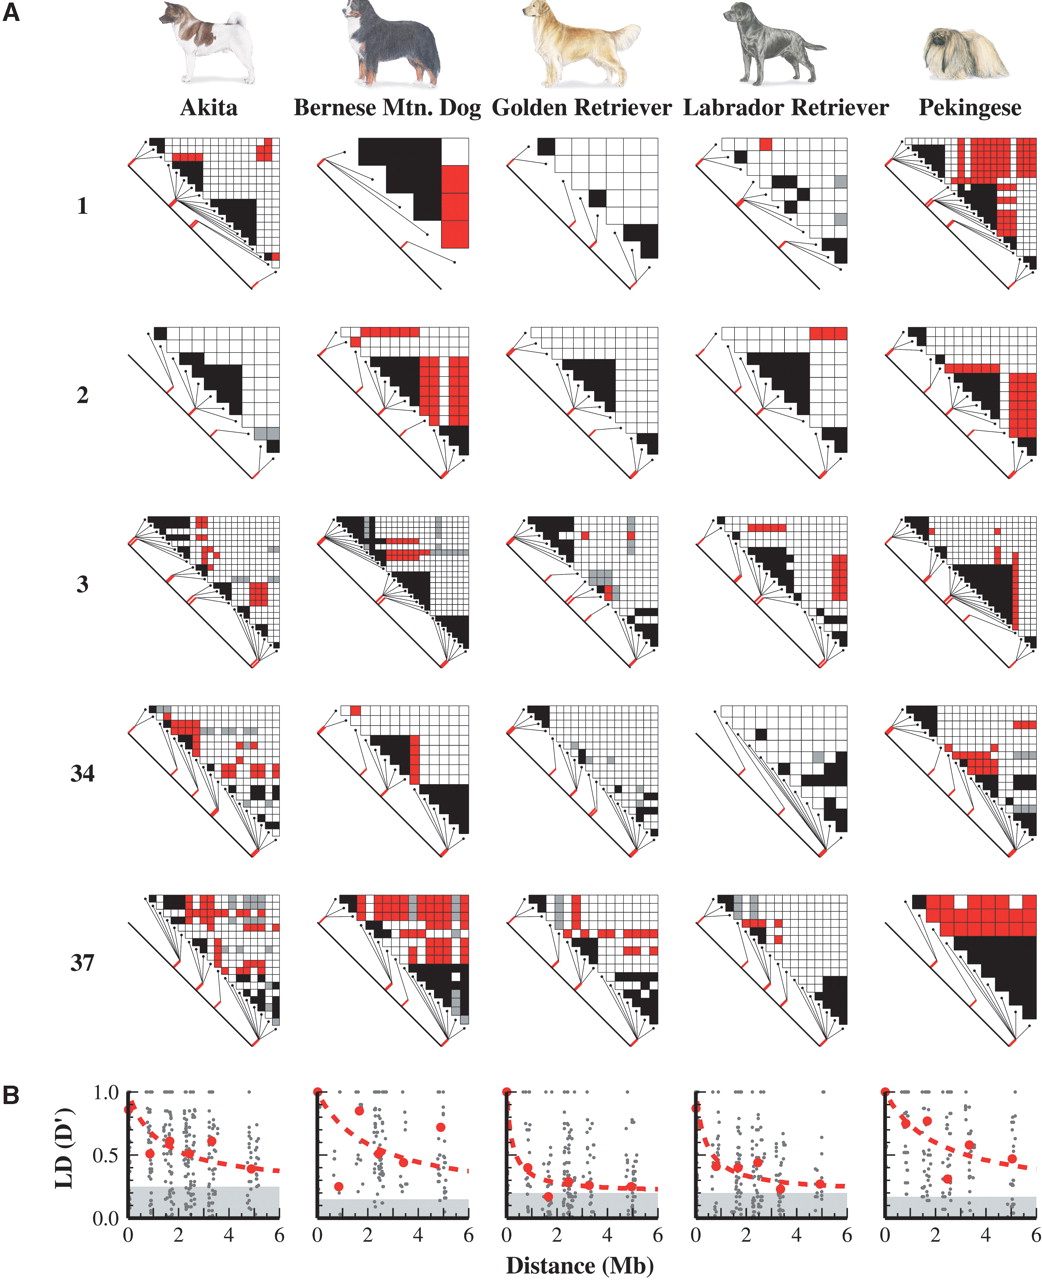
(A) Triangle plots of LD between common SNPs (MAF > 0.2) for each chromosome and dog breed. Black squares represent SNP pairs in significant LD (D′ > 0.8; P < 0.01) and <100 kb apart. Red squares indicate significant LD between markers at least 0.8 Mb apart. Gray squares represent high LD values (D′ > 0.8) that are less significant (P > 0.01). (B) LD (D′) decay plots for common SNPs (MAF > 0.2) in each dog breed corresponding to the triangle plots above. Red circles show the median LD values within each bin of marker pair distances, and the dashed line is a best-fitting curve to the median values. Gray shading indicates the background LD level between unlinked markers. The top of the gray rectangle shows the median of D′ values between markers on different chromosomes.


