
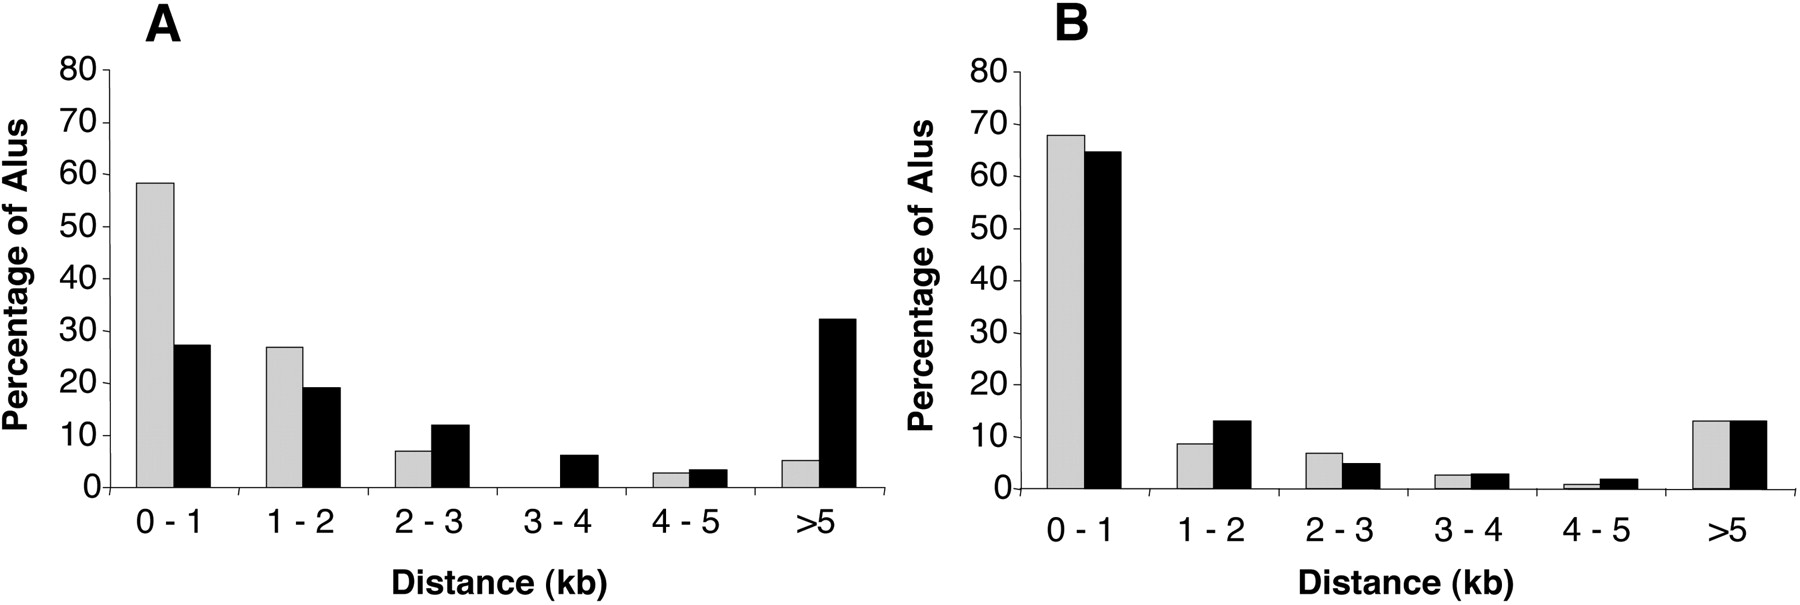
Figure 2.
Distance from edited and unedited Alus to the nearest Alu in the same intron. The Alu sequences included in this analysis are the same as in Figure 1. The proportion of edited Alus (gray bars) and the proportion of unedited Alus (black bars) at different distances from the nearest antisense Alu (A) or same sense Alu (B) are shown.


