
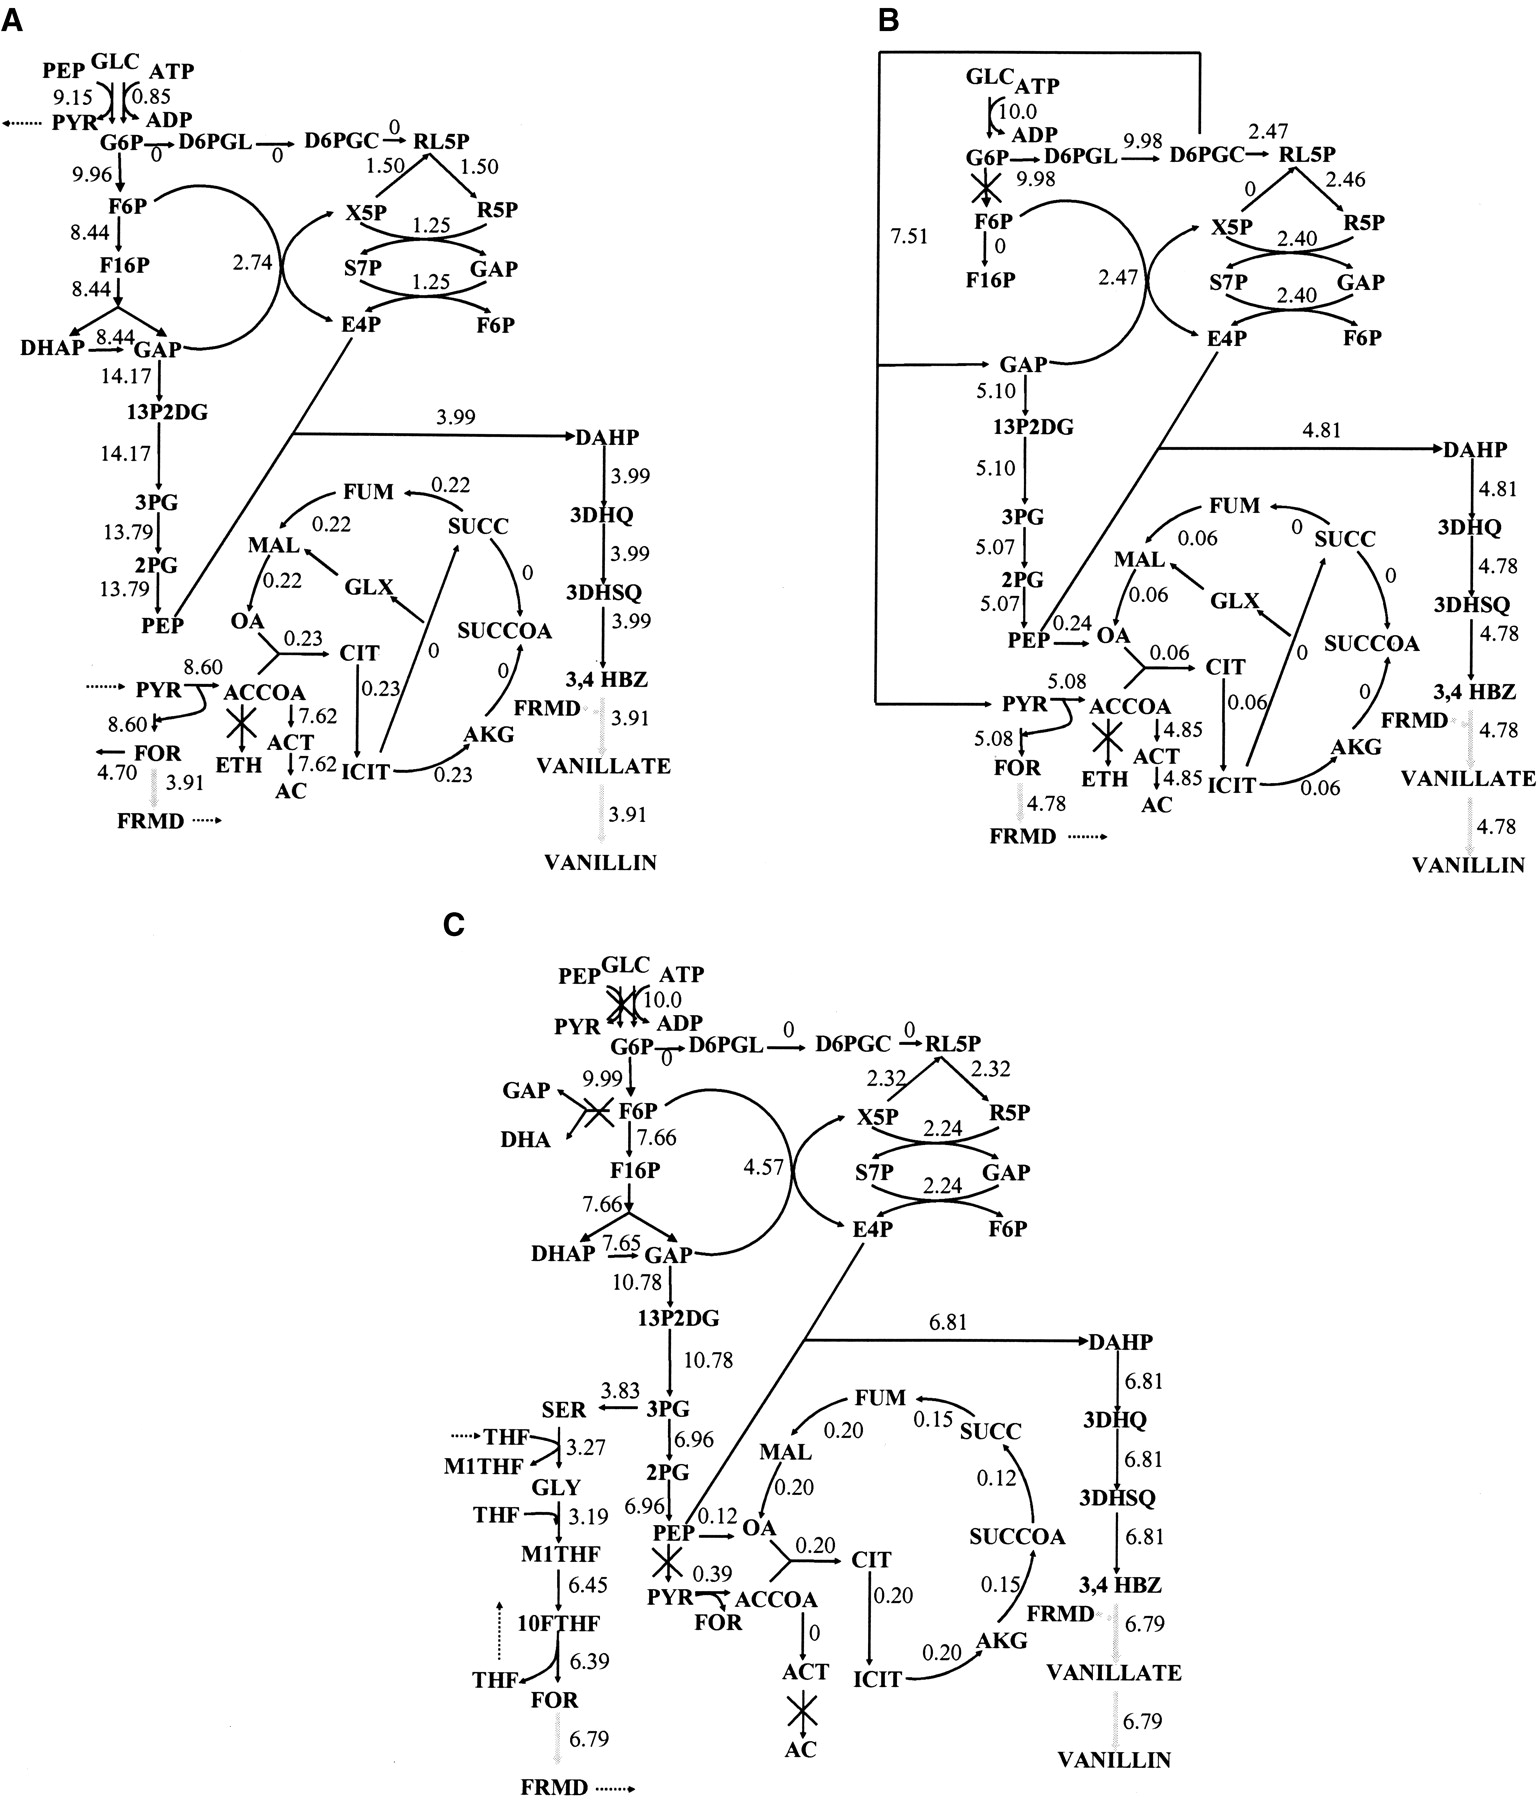
Figure 7.
Calculated flux distributions at the maximum growth rates in the (A) one, (B) two, and (C) four deletion E. coli mutant networks for overproducing vanillin. Non-native reactions are denoted by the thicker gray arrows. A basic glucose uptake rate of 10 mmol/gDW per hour was assumed.


