
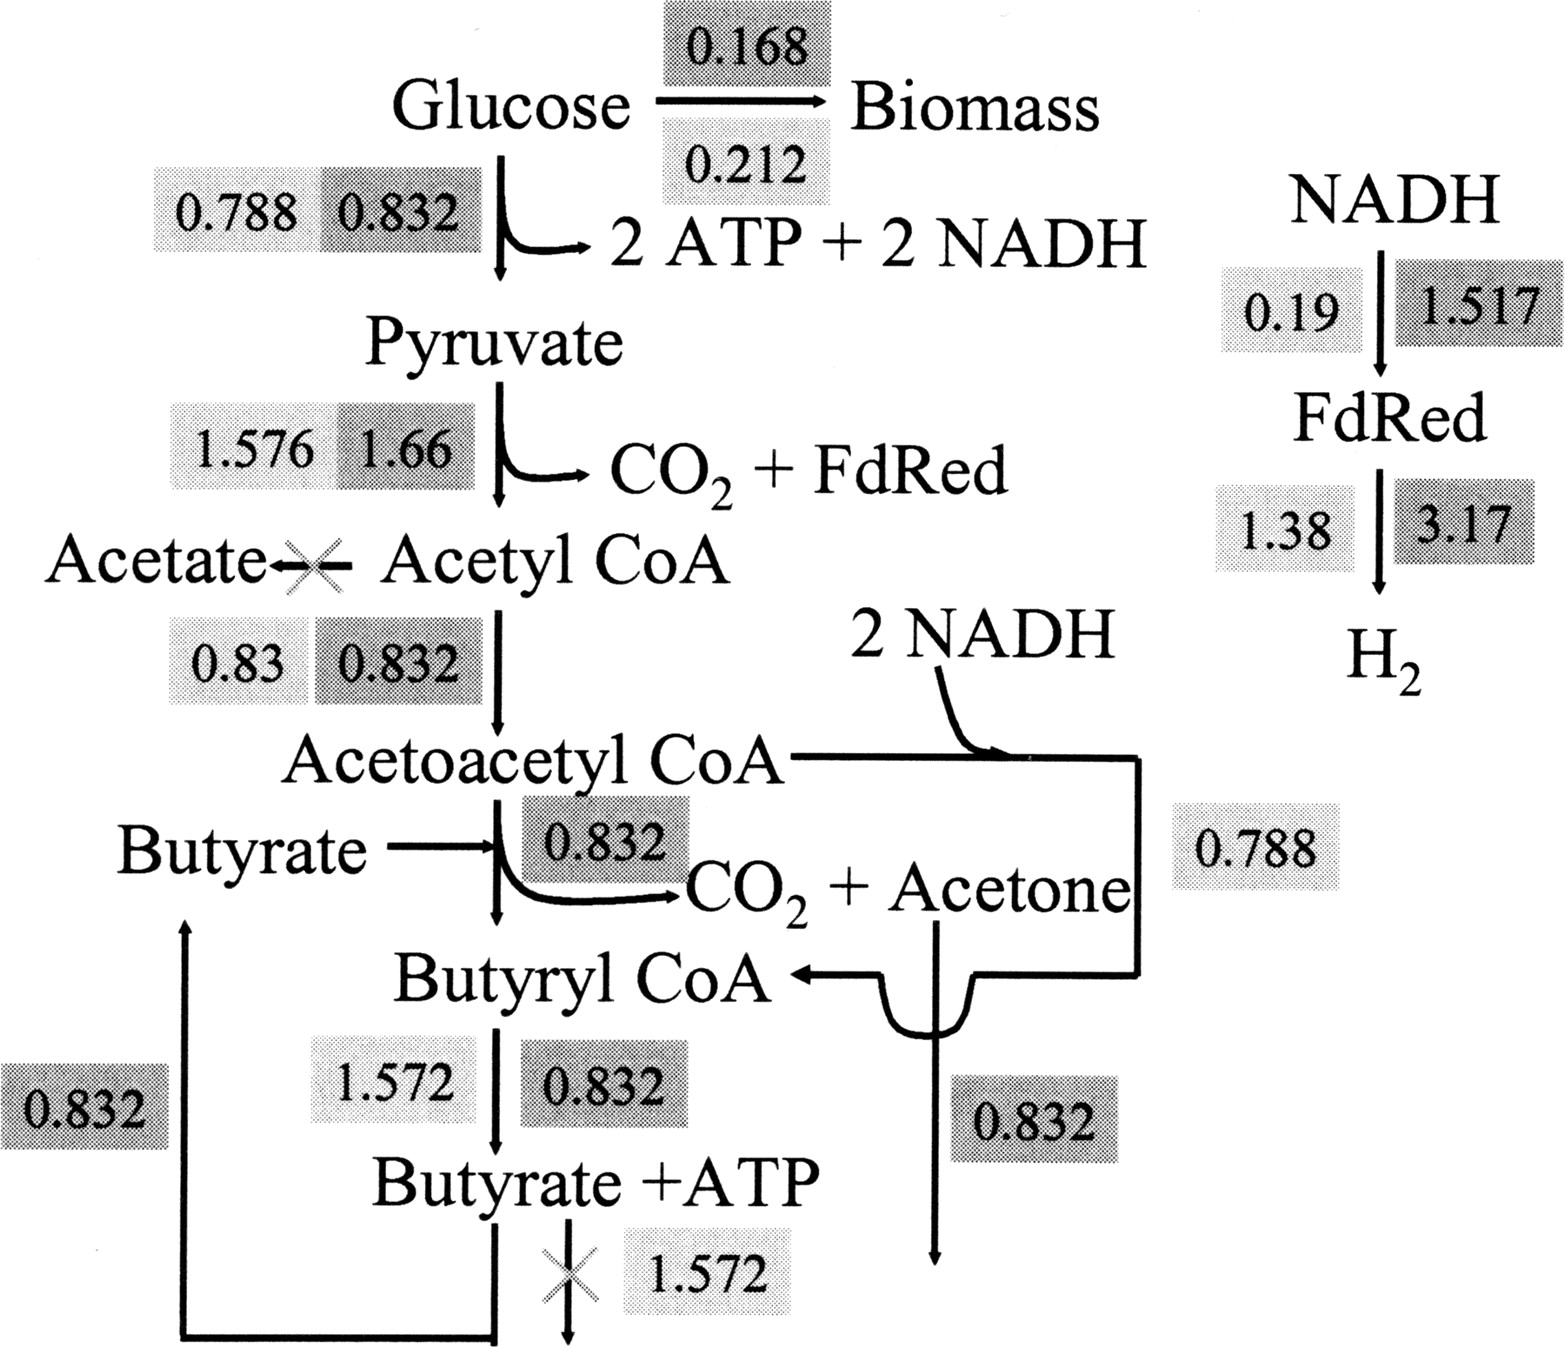
Figure 5.
Calculated flux distributions at the maximum growth rates for the wild-type (light gray) and the two-reaction deletion mutant (dark gray) C. acetobutylicum networks. The ×s denote reactions that were selected for elimination in the mutant network. The wild-type network flux values are for the minimum hydrogen production scenario, corresponding to point A in Figure 6.


