
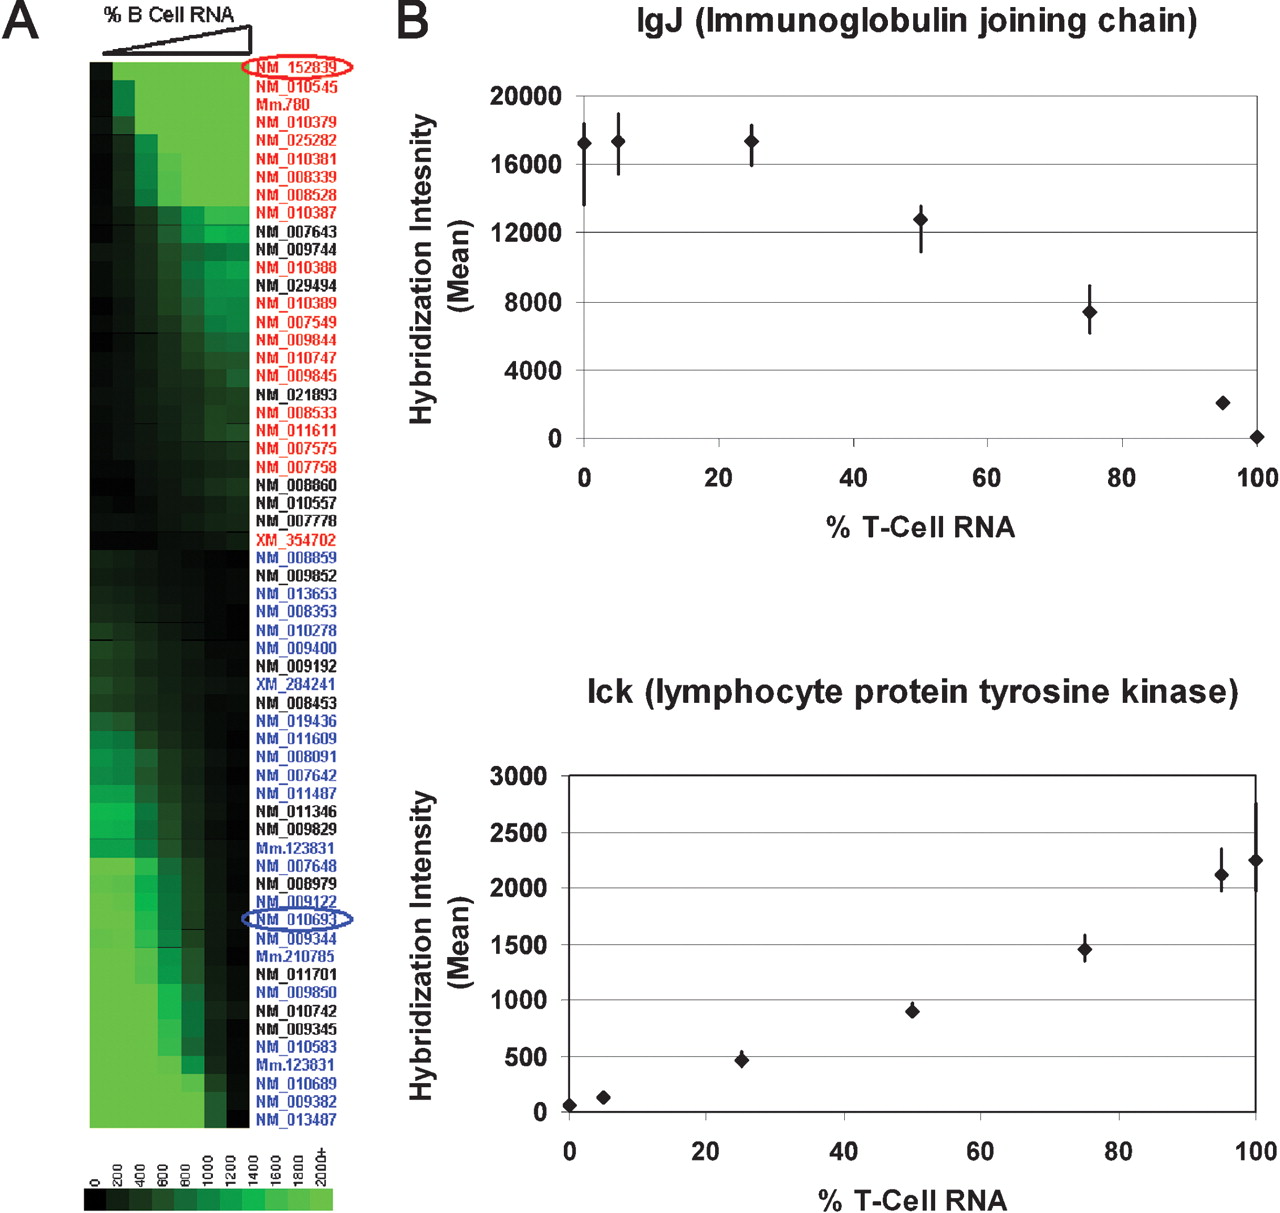
B Cell/T Cell experimental results. Seven RNA samples were prepared containing mixtures of B- and T-cell lymphoma cell-line mRNA. The samples contained 0%, 5%, 25%, 50%, 95%, and 100% B-cell RNA, with the balance in all cases being T-cell RNA. These samples were labeled by our standard protocol and hybridized to six separate arrays each. (A) The hybridization intensities of the 59 most tissue-specific genes are plotted. Each vertical stripe represents a sample and each horizontal row a gene. Boxes represent the mean hybridization intensities measured in six replicate array hybridizations. The intensity scale is shown in the legend at the bottom. Genes are labeled according to their RefSeq or UniGene ID numbers. The colors of these labels indicate prior evidence in the literature of B- or T-cell-specific expression (red refers to B-cell-specific expression; blue refers to T-cell-specific; see Table 2 for references). (B) The dose responses of two representative genes identified in this experiment are plotted. Points represent the mean intensities for each concentration. Error bars represent 90% two-sided confidence intervals calculated from six replicate hybridizations.


