
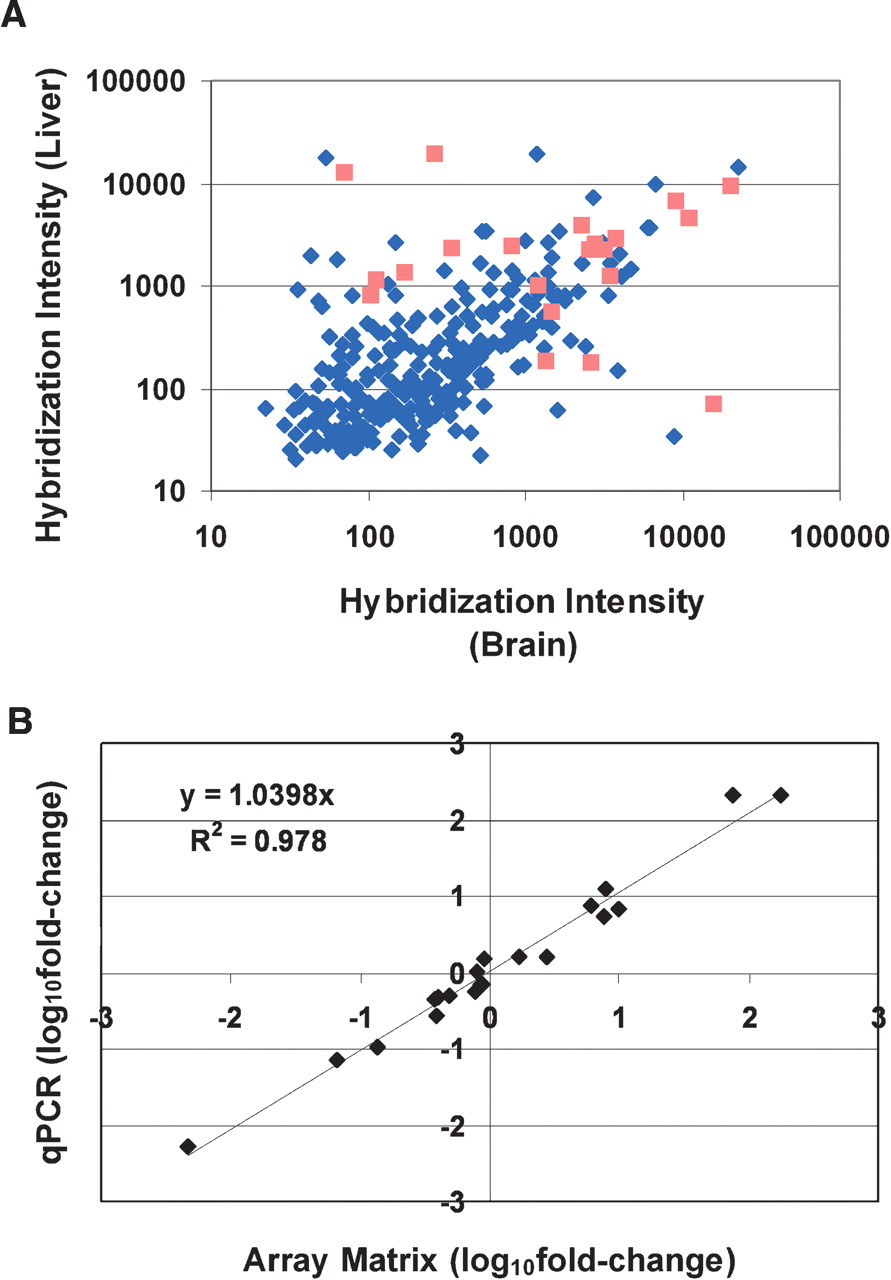
Figure 7.
Correlation of array matrix data to quantitative real-time PCR. Labeled RNA samples were made from human and brain total RNA. These were hybridized to separate array matrices containing 633 human genes. Six technical replicates were included for each sample. Twenty-one genes from this list were selected for analysis by TaqMan quantitative real-time PCR. A scatter plot of hybridization intensities of the liver and brain samples on the array matrix is shown in A. Genes selected for further analysis are shaded orange. A scatter plot of log-transformed hybridization signal ratios as determined by the two methods is shown in B.


