
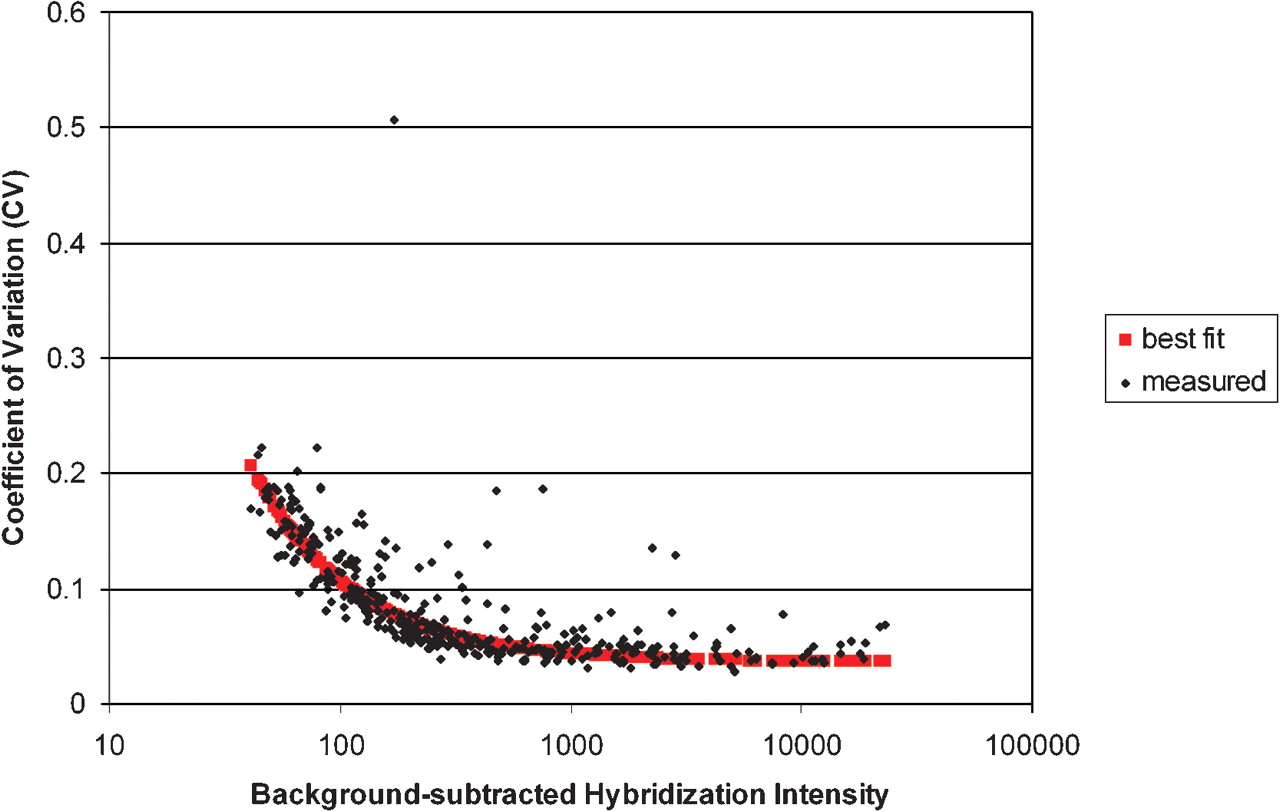
Figure 5.
Array signal variation as a function of gene hybridization intensity. Each blue dot represents a gene and the red line represents a smoothed function for the data on the basis of a robust best-fit function for standard deviation vs. intensity. All values are based on background-subtracted raw data from 48 replicate hybridizations. The data shown are from one experiment of the 15 described in the legend to Figure 4. This experiment was chosen to represent the others on the basis of its measurement precision, which is the median of measurement precisions for all 15 experiments.


