
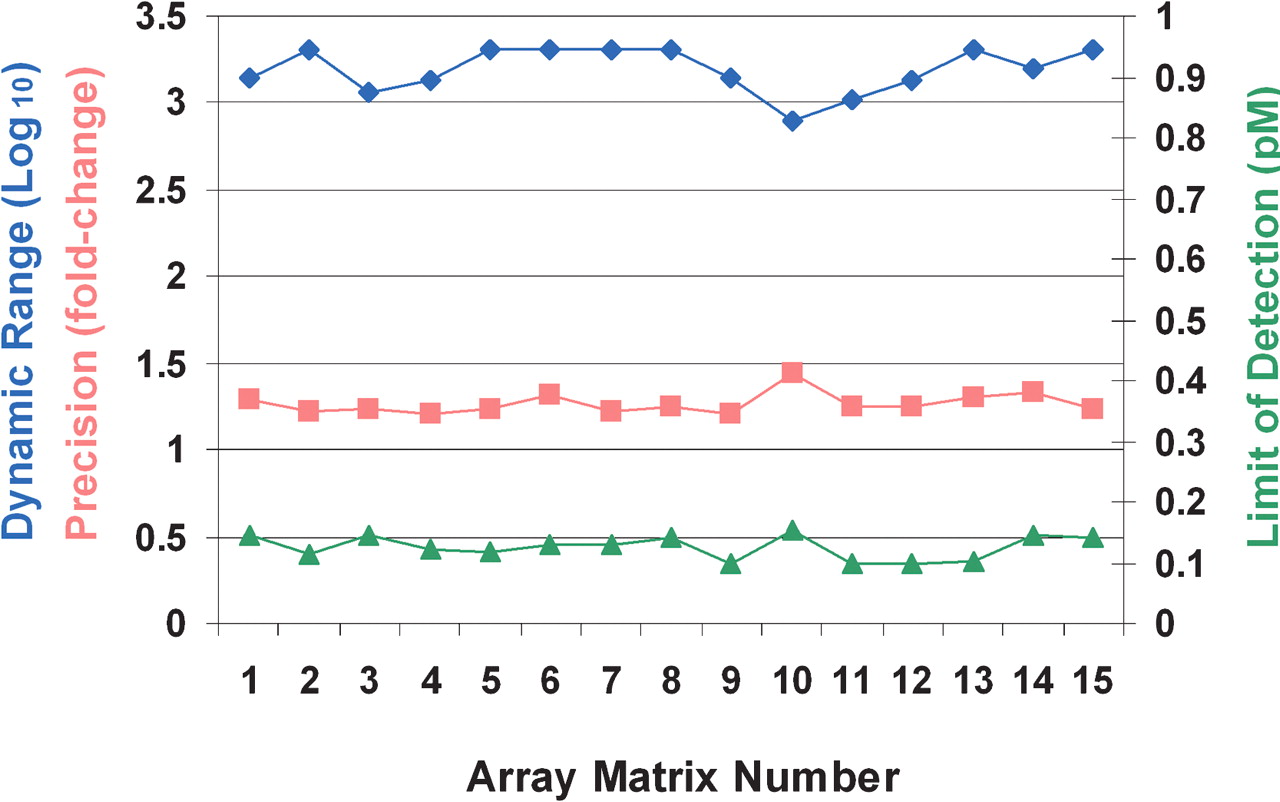
Dynamic range, detectable fold change, and limit of detection for 15 array matrices. The array matrices, manufactured on five separate days, were used to perform dose-response experiments identical to that described above, except in these experiments, we used four replicates per concentration instead of eight. Dynamic range corresponds to the concentration range over which twofold concentration changes can be distinguished with 95% confidence (represented by the green portions of the lines in Fig. 3); the values plotted in the graph (blue diamonds, left axis) are determined by dividing the upper concentration limit of this range by the lower limit for the given experiment. Precision (orange squares, left axis) corresponds to the distinguishable fold change across the determined dynamic range. Limit of detection (green triangles, right axis) corresponds to 0.99 detection p-value generated using normal model of intensities of 20 negative control probes that have no corresponding target in the sample. All performance values given represent the median value for the nine spike targets used in the experiment.


