
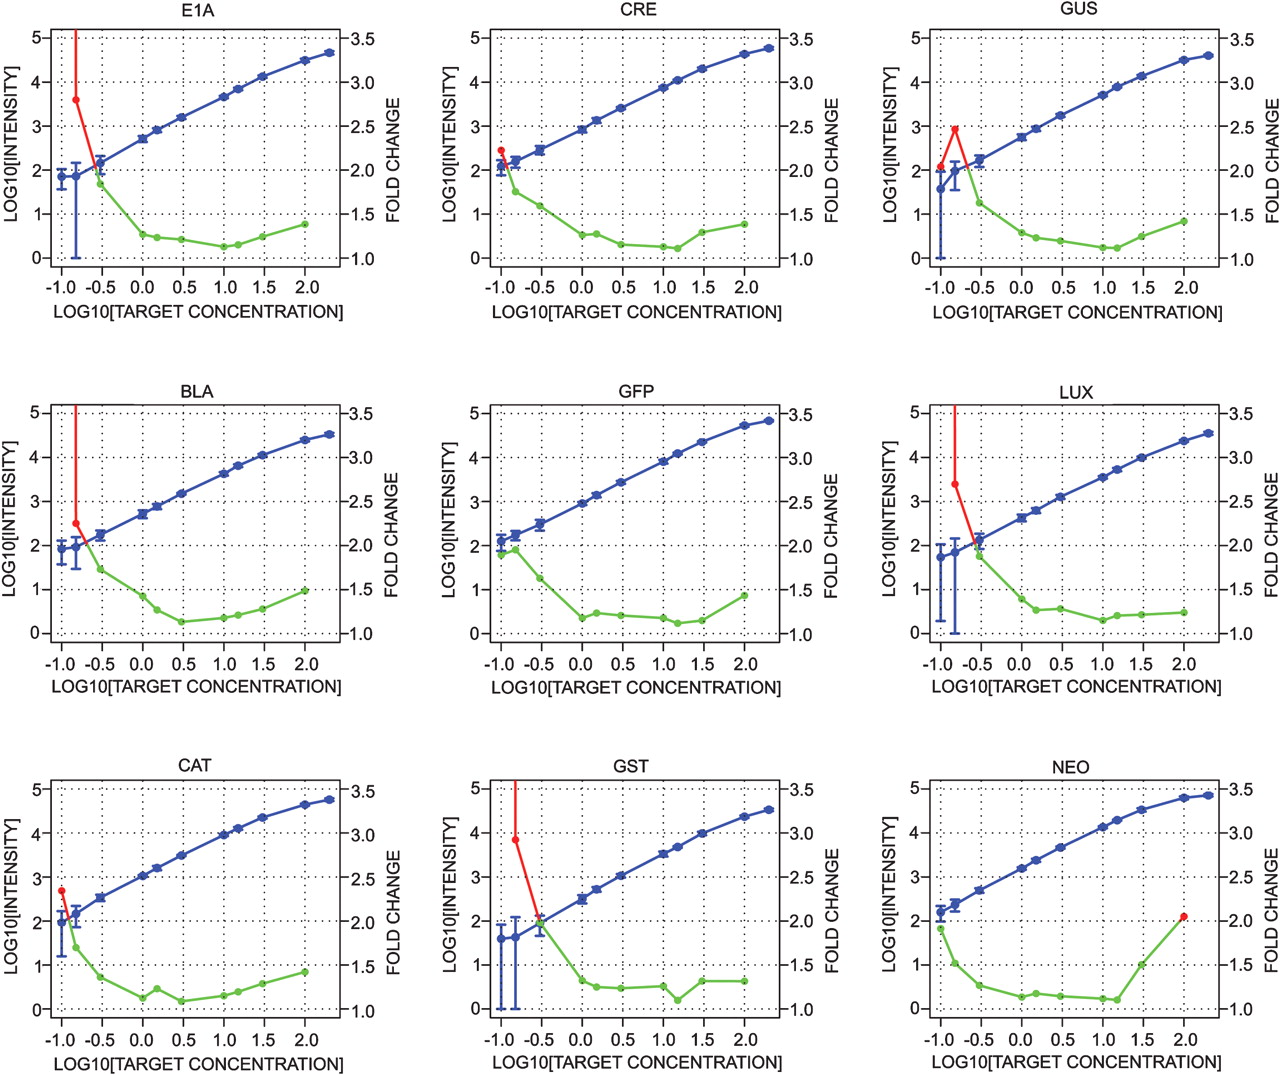
Dose-response curves. Data points represent the mean of eight arrays. Signal intensities are plotted in blue vs. target concentration. Error bars represent the two-sided symmetric 90% confidence intervals for a single reading, calculated on the basis of the spread of eight separate readings. All points contain error bars, but some are too small to be resolved at the plotted scale. The resolvable fold change is plotted in red and green vs. target concentration. Each data point estimates the ability to distinguish concentration fold change for a single reading. Concentration levels are defined as resolved when estimated one-sided 95% confidence intervals do not overlap. Values below twofold are colored green, whereas those greater than twofold are colored red.


