
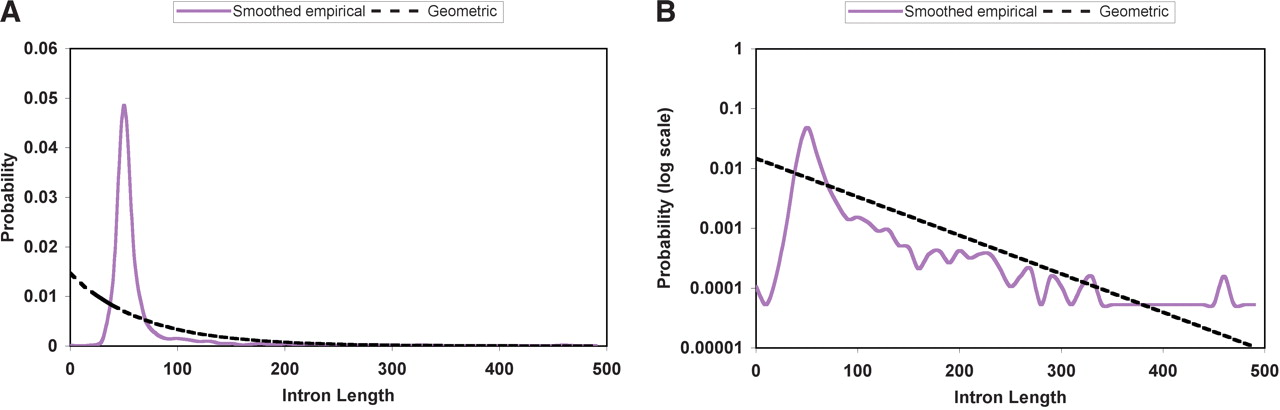
Figure 1.
Intron length probability distributions used. The smoothed empirical distribution (purple, solid line) closely mirrors the observed intron lengths in the training set (not shown). The geometric distribution (black, dashed line) is the unique member of the geometric family with mean intron length equal to that of the training set (68 bp), but it is clearly a poor fit to the observed distribution. (A) Linear scales; (B) log scale on probability axis.


