
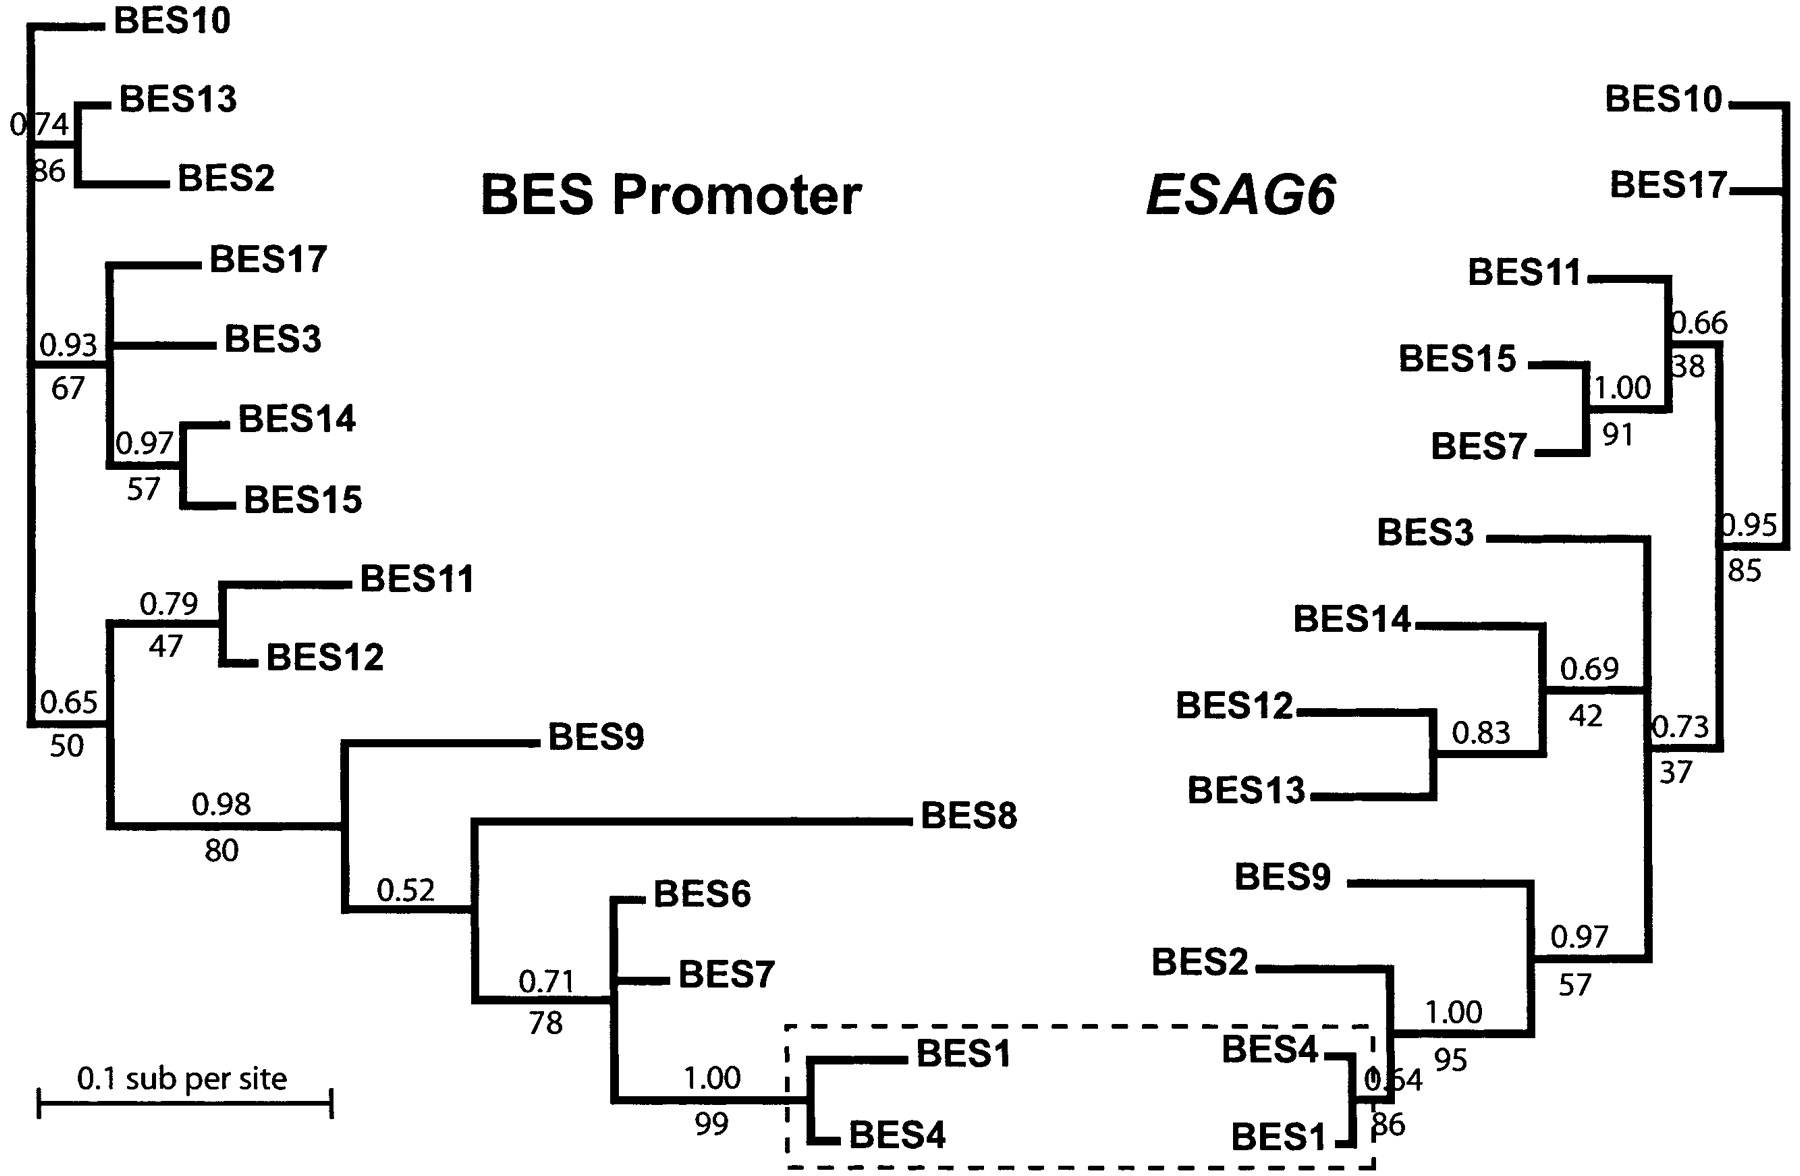
Figure 7.
Phylogenetic analysis of BES promoter and ESAG6 sequences. The trees shown were calculated by Bayesian inference. Posterior probabilities (the proportion of time any given topology was visited during tree inference) are shown above branches. Support for the Bayesian topology from maximum parsimony methods is indicated by bootstrap values (%) under branches. Only one node of the overall topology is common to both trees (boxed).


