
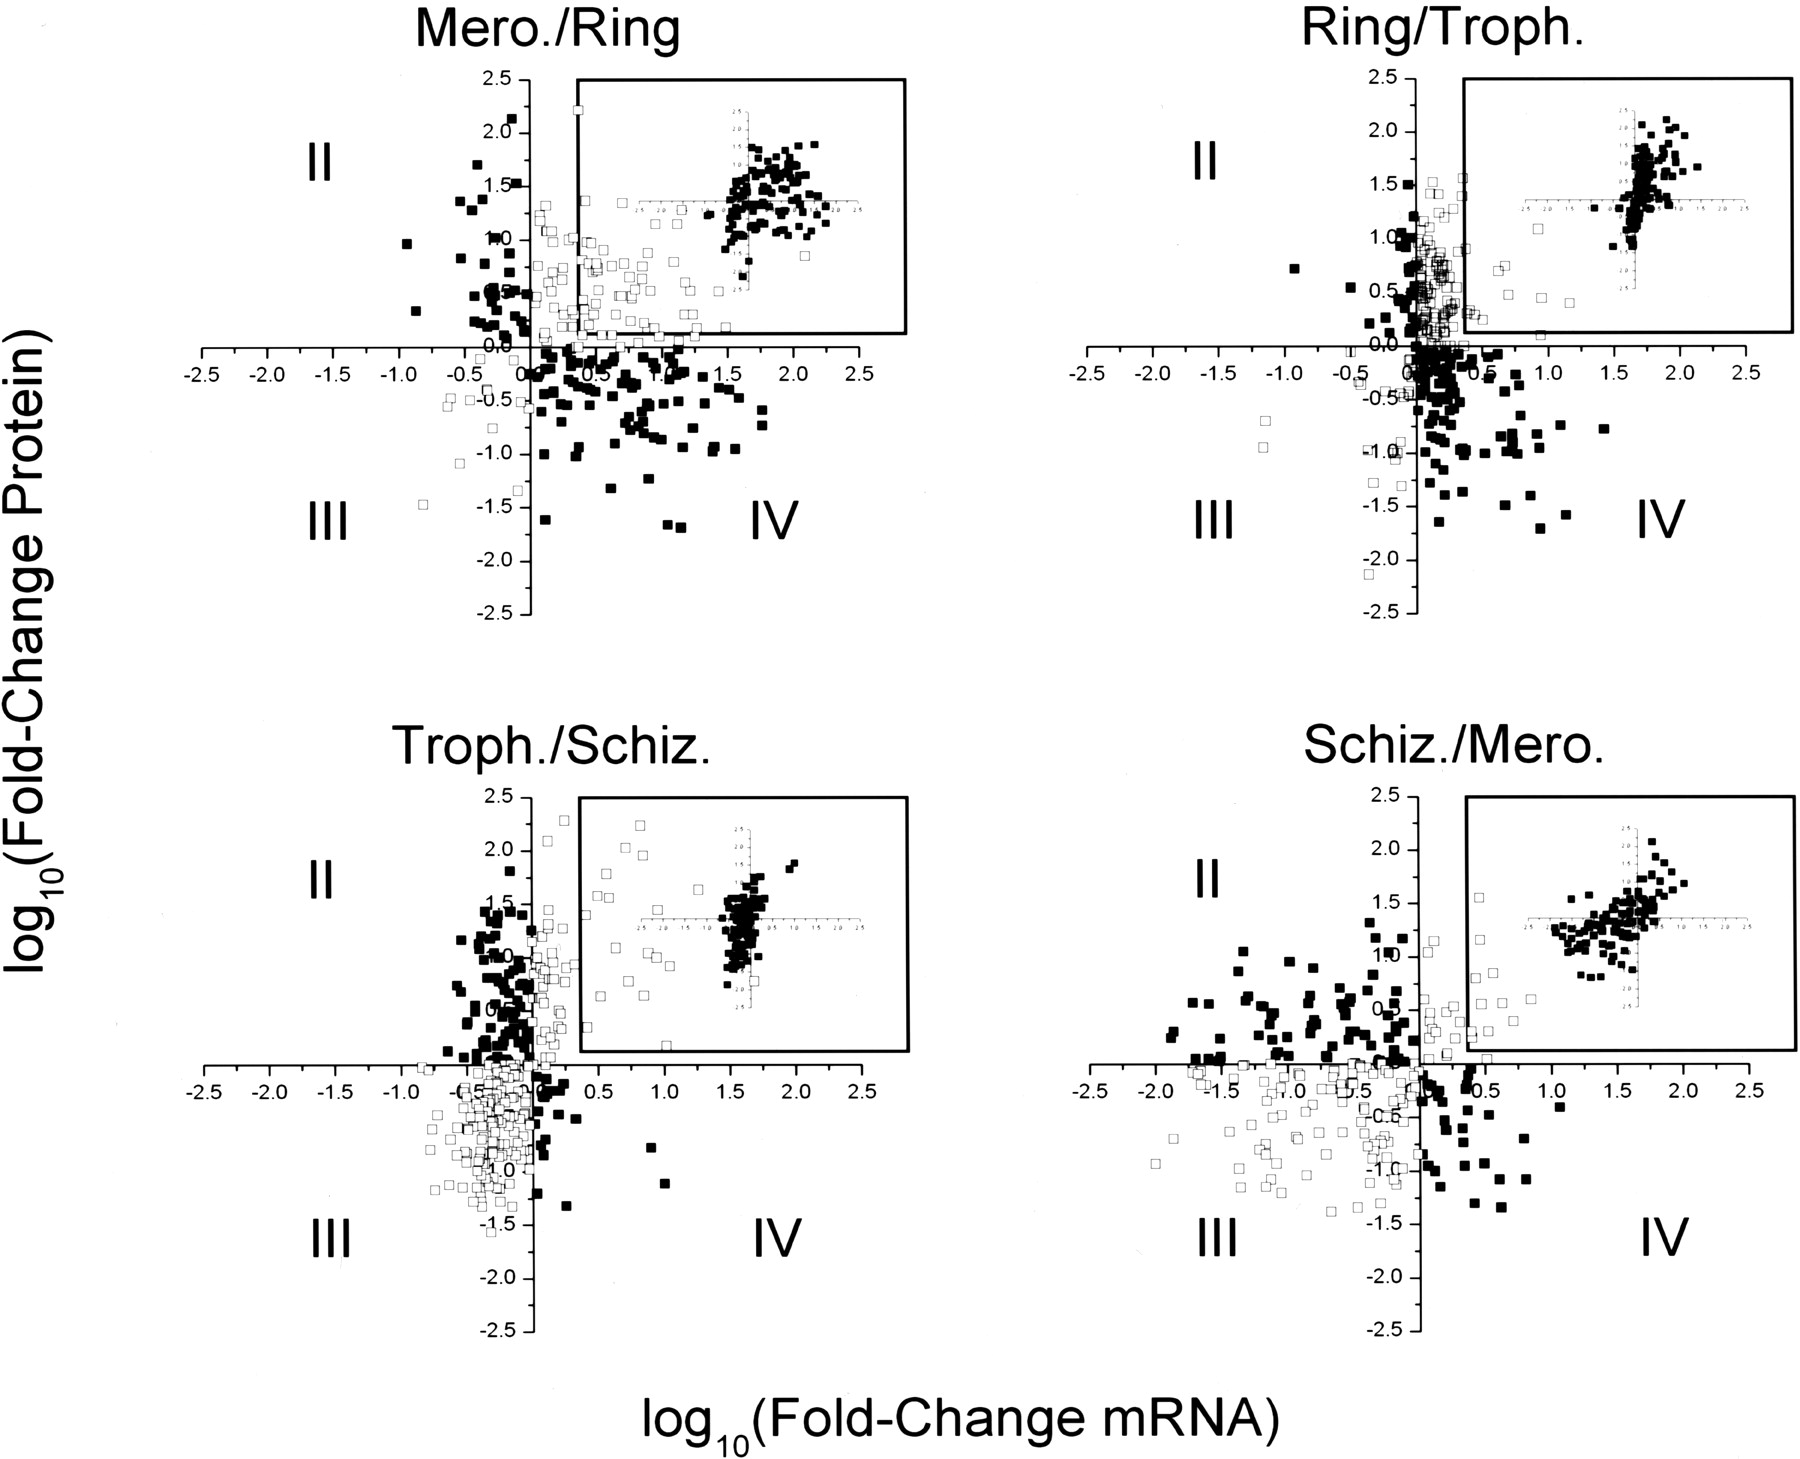
Scatterplots of mRNA and protein fold-changes during developmental transitions. The fold-change in mRNA abundance vs. the fold-change in protein abundance is plotted for each transition in the asexual erythrocytic cycle. Quadrants are designated with roman numerals. Data points falling into quadrants I and III were given open circles, data points falling into quadrants II and IV were given closed circles. Data points that fell into quadrants II and IV were replotted (inset) as the mRNA fold change of the transition indicated vs. the protein fold change of the following transition (i.e., the inset of Mero./Ring is a plot of the fold change in mRNA abundance for the merozoite-to-ring transition vs. the fold change in protein abundance for the ring-to-trophozoite transition).


