
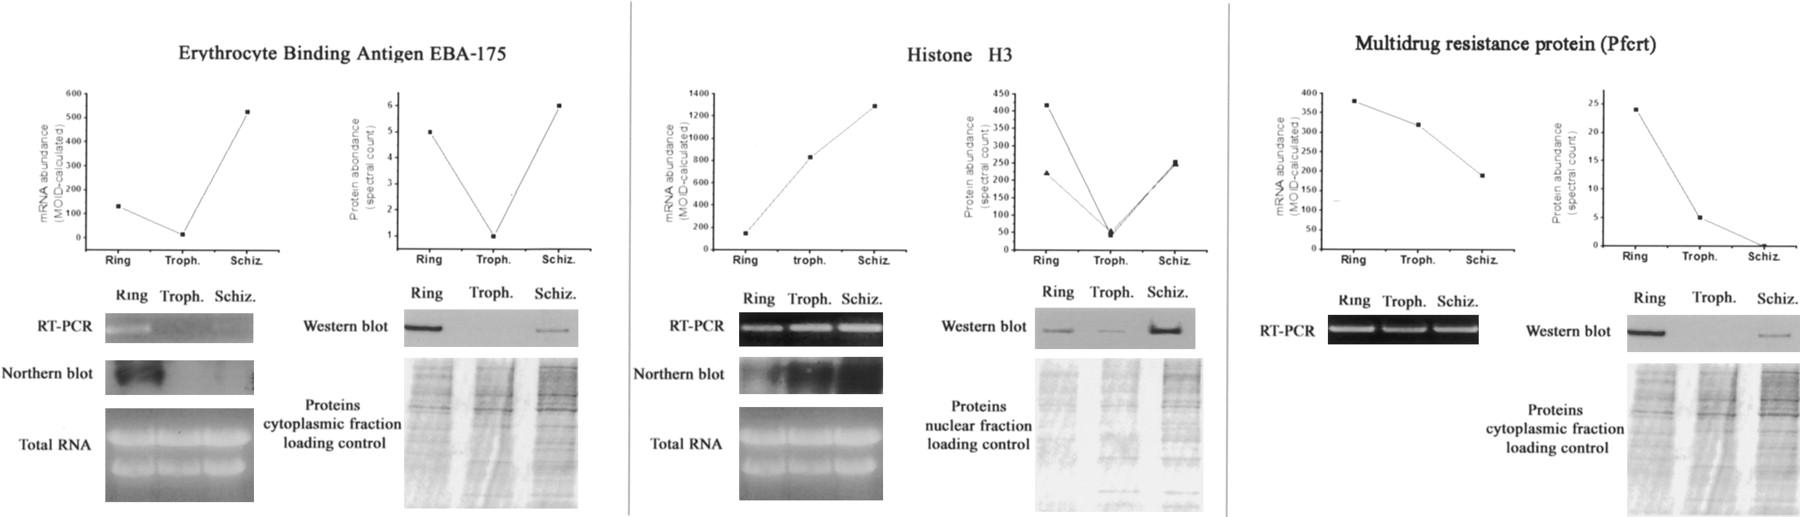
Validation of mRNA and protein abundance using a single parasite population. mRNA and protein expression levels obtained by oligonucleotide array analysis and MudPIT,respectively, were validated for the erythrocyte-binding antigen 175 (EBA-175, PF07_0128, closed circles), the histone H3 (MAL6P1.106, closed circles and MAL6P1.248, closed triangles), and the chloroquine-resistance transporter (Pfcrt, PFE1150W) using RT-PCR, Northern blot (for PF07_0128 and MAL6P1.248), and Western blot analyses as indicated. MOID-calculated mRNA abundance and spectral count-estimated protein abundance are indicated in the top graphs. Probes specific for the MAL6P1.248 gene were not represented on the oligonucleotide array. Discrepancies between the wet experiments (RT-PCR, Northern blot, and Western blot) and the whole-genome experiments should be expected, as they were performed on different parasite populations extracted at different times.


