
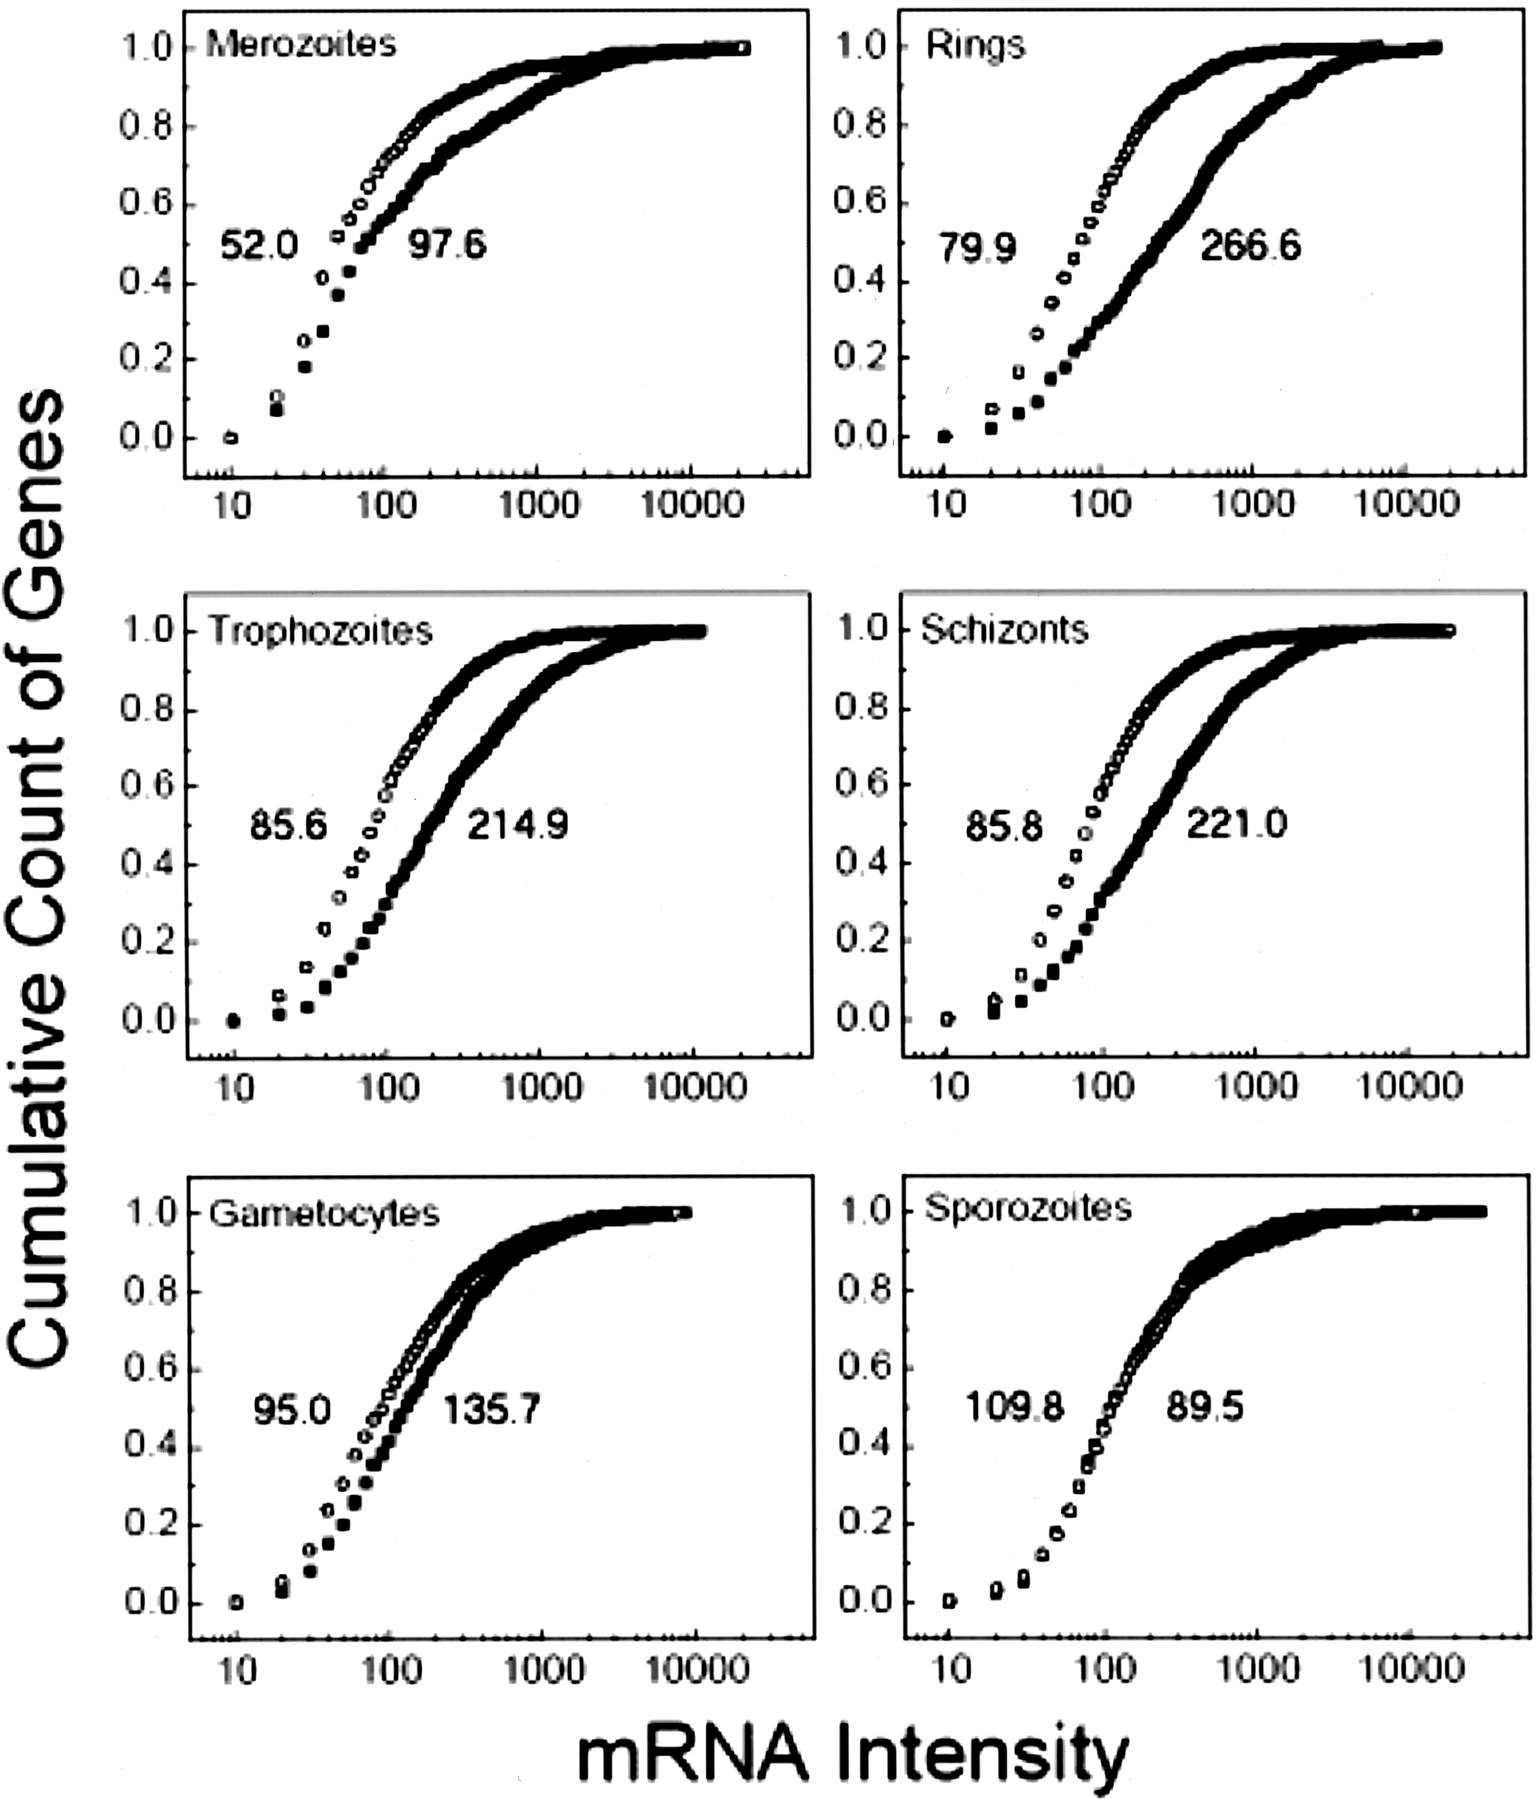
Figure 1.
Cumulative distributions of mRNA intensity. Cumulative intensity distributions of mRNA intensity are plotted for each stage where both transcriptome and proteome data was available. Intensity distributions are represented for the cognate proteins that were not detected (open squares), or were detected (closed circles) in the same stage by the proteomic analysis, with median intensities indicated to the left (proteins not detected) and right (proteins detected) of the curves.


