
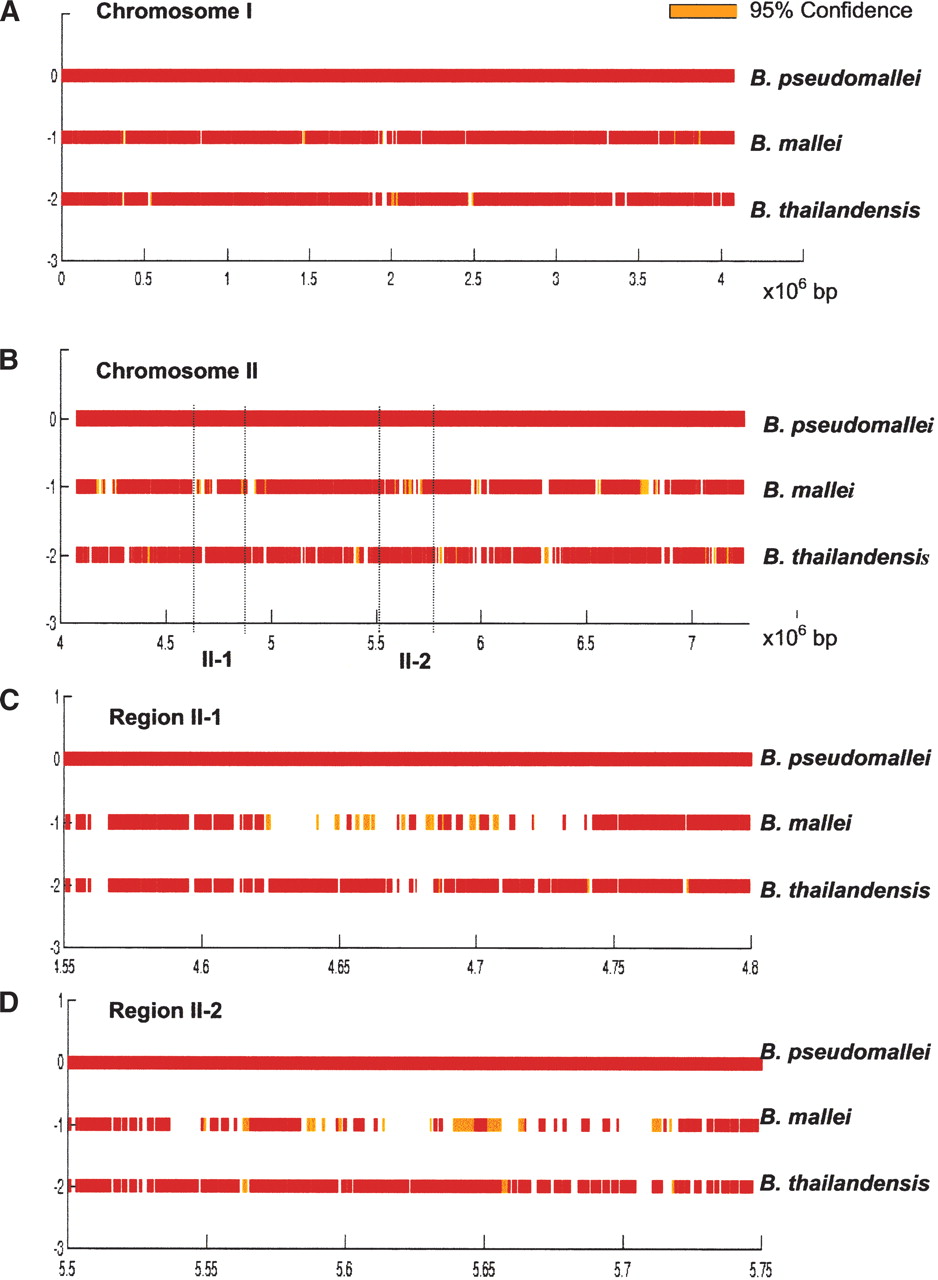
Figure 3.
Regions of deletion in B. mallei and B. thailandensis along the B. pseudomallei genome, using t-tests. Chromosome 1 (A) and Chromosome 2 (B) in terms of 106 base pairs. White gaps represent regions deleted at >99% confidence. Orange areas represent deleted regions at the lower level of confidence, 95%. (C,D) Higher-resolution figures for regions II-a and II-b. For z-score versions of A–D, please see Supplemental material.


