
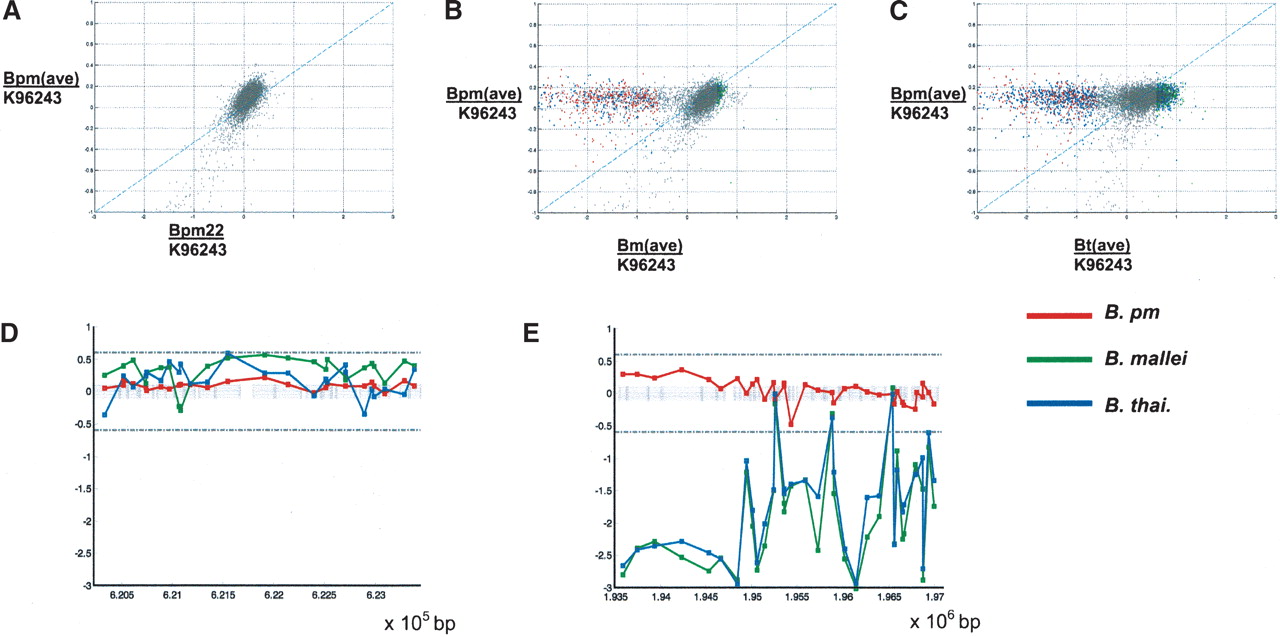
Identification on differentially present ORFs across different Burkholderia species and strains. (A–C) Log-log scatter plots of fluorescence ratios of (A) the average B. pm (Burkholderia pseudomallei) profile (x-axis) vs. an individual B. pm sample (y-axis), (B) the average B. pm profile vs. the average B. mallei profile, and (C) the average B. pm profile vs. the average B. thailandensis profile. Red spots denote deletion with 99.99% confidence, green (amplification with 99.99% confidence), and blue (deletion or amplification with 99% confidence, deleted spots lying to the left of the diagonal axis, and amplified spots to the right). (D,A) Fluorescence ratios of various Burkholderia species plotted against chromosomal position. Red denotes the average B. pm, green (B. mallei), and blue (B. thailandensis). The left figure indicates a genomic region that is present in all three species. The right figure illustrates a separate genomic region that is completely deleted in both B. mallei and B. thailandensis.


