
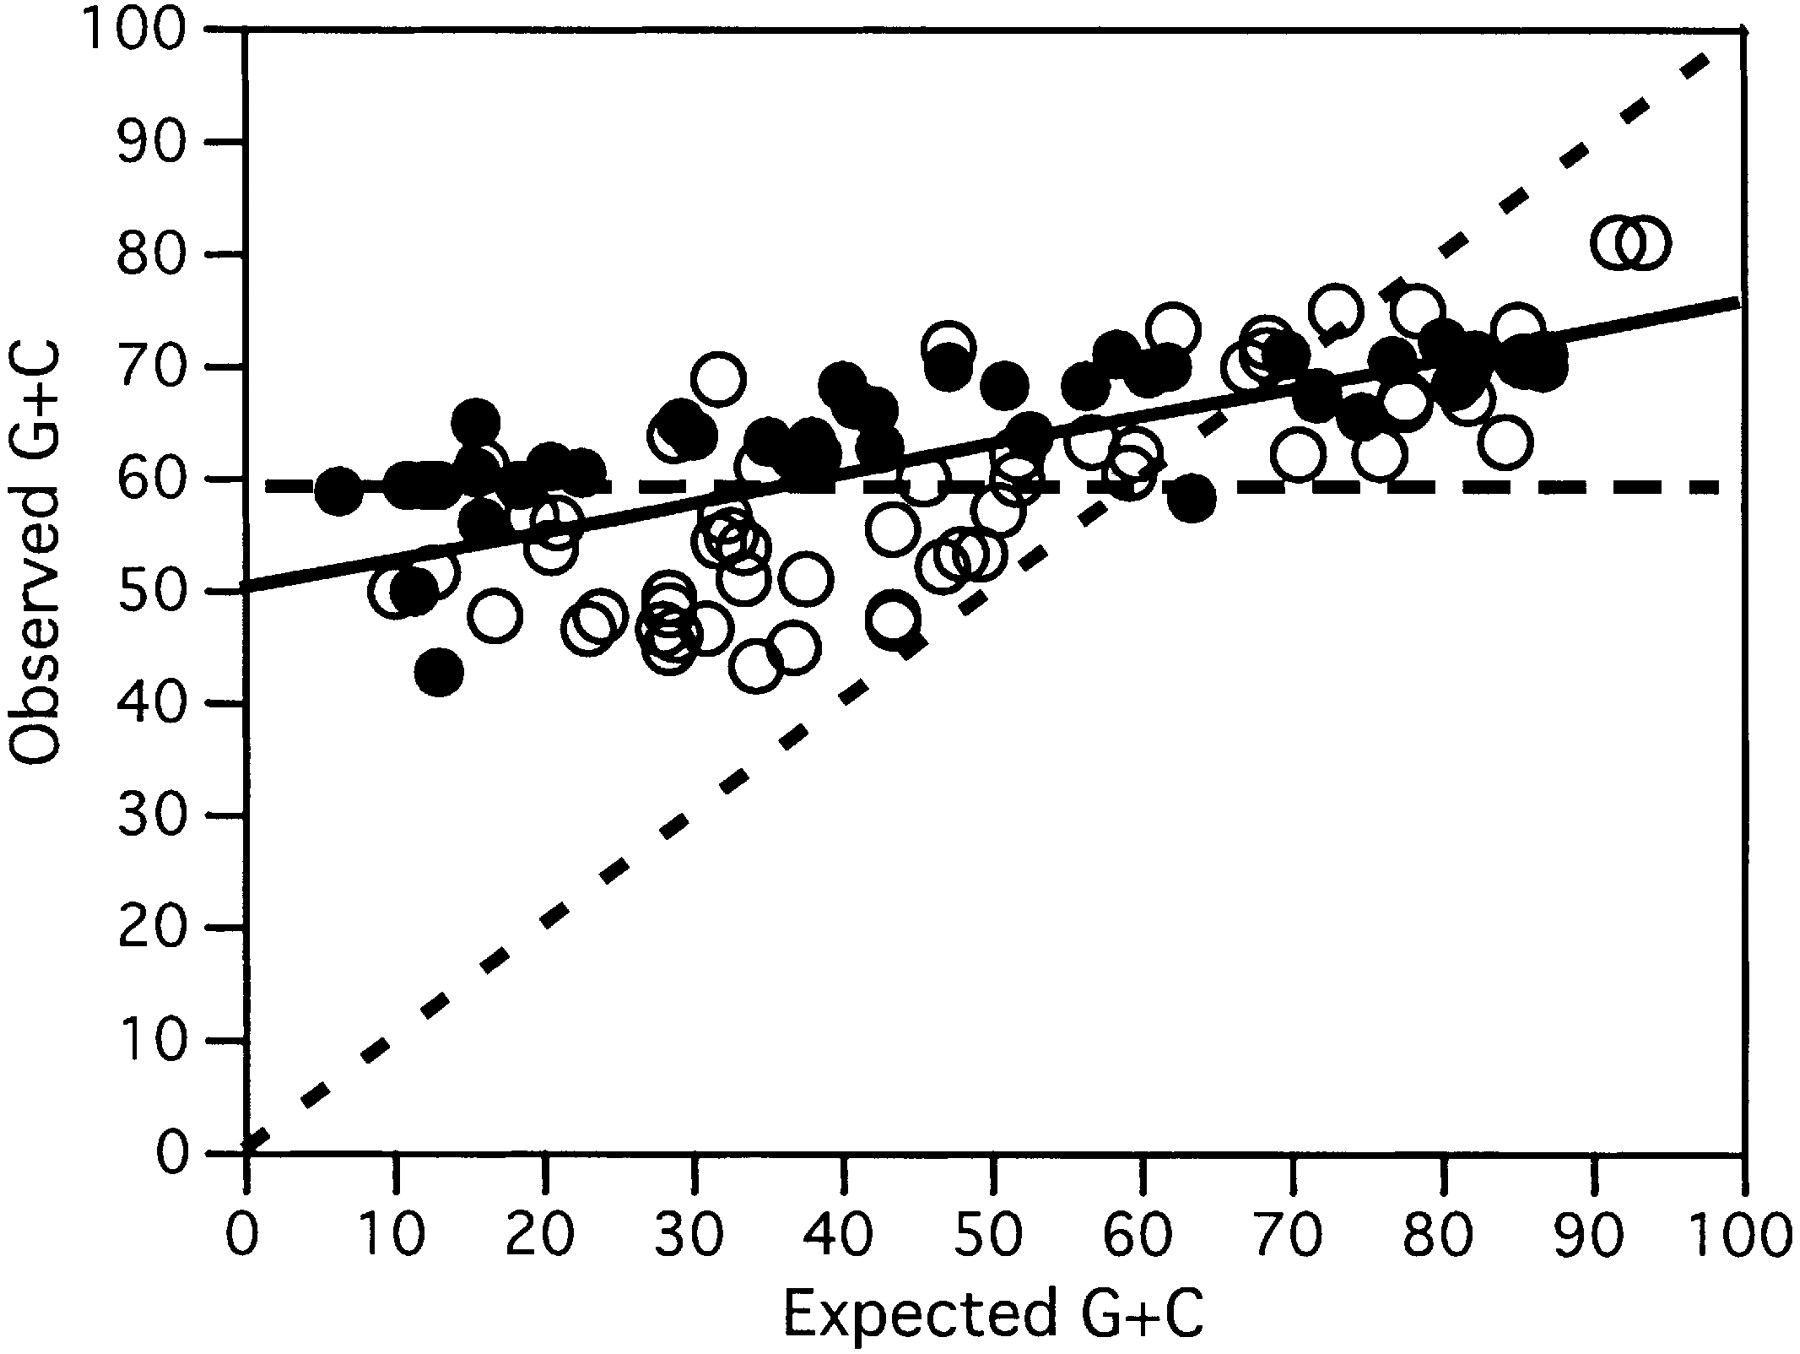
Figure 2.
Observed versus expected G+C composition of tRNA anticodons. Expected was computed using an update of the Muto and Osawa (1987) equations and is indicated by the black dashed main diagonal. The horizontal dashed line indicates the expected value if there was no change in G+C anticodon composition with genome G+C content. The linear regression of the observed data is shown as a solid black line (it has an R2 of 0.50 and a slope of 0.26, significantly different from 1 and 0, P < 0.001).


