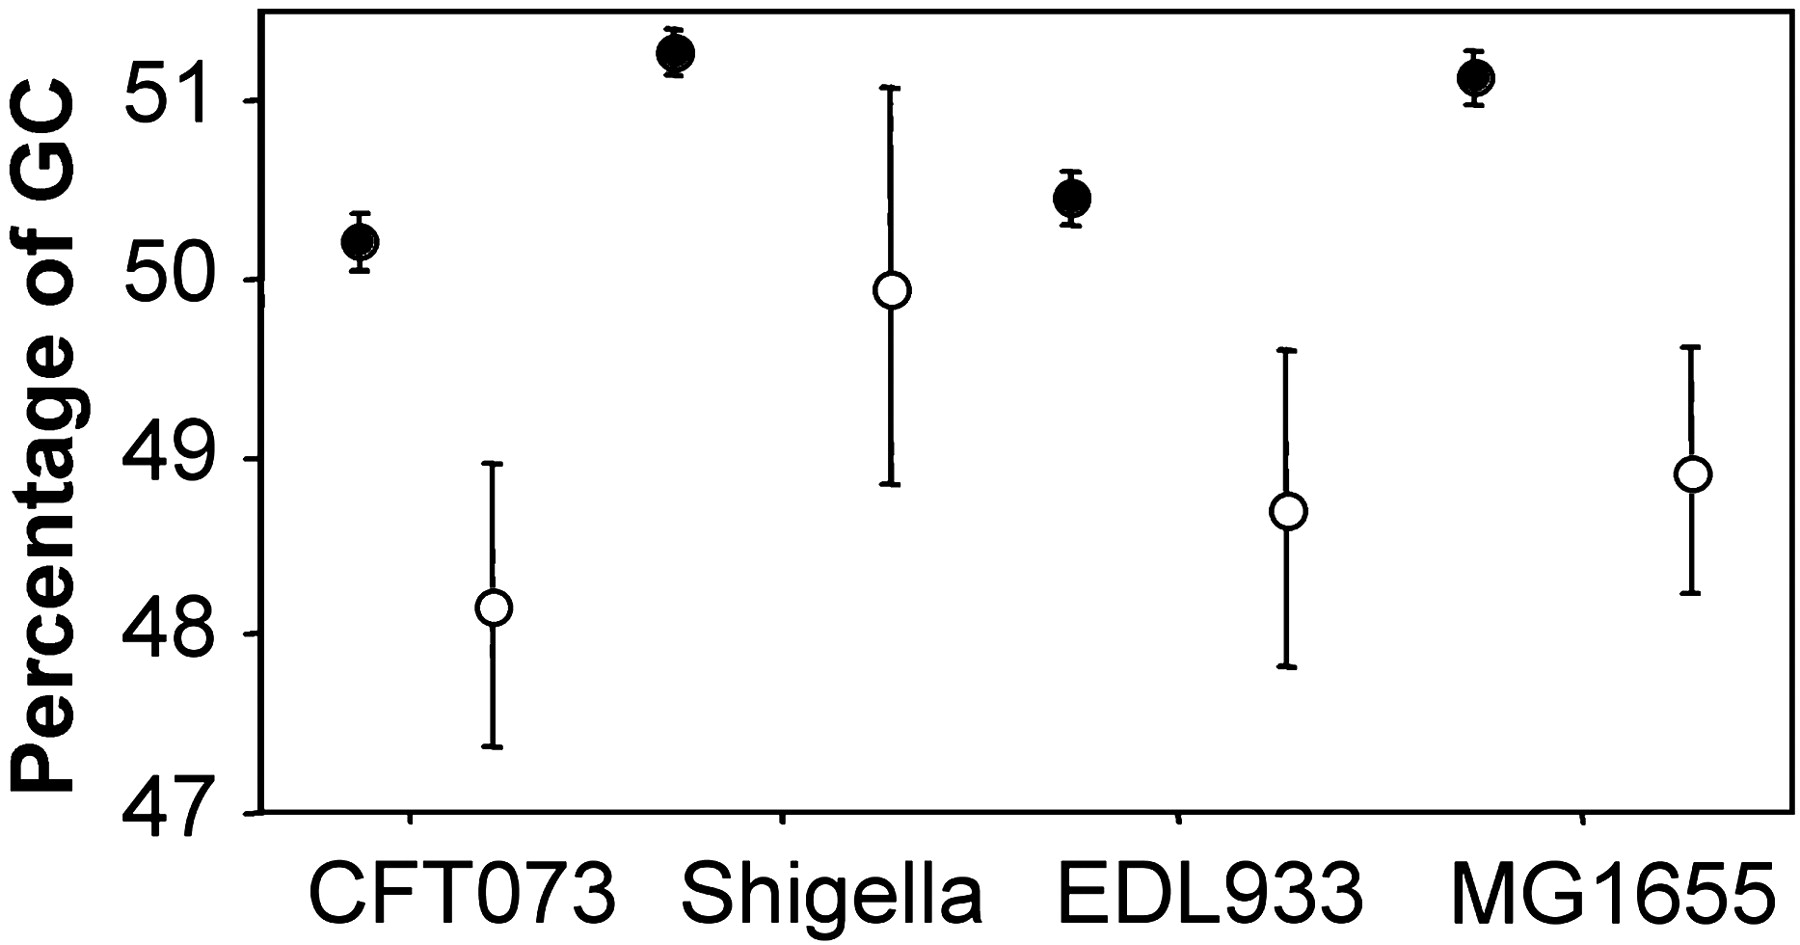
Ψ-Φ: Exploring the outer limits of bacterial pseudogenes

(Downloading may take up to 30 seconds. If the slide opens in your browser, select File -> Save As to save it.)

Click on image to view larger version.

Figure 3.
Figure 3.

Average G+C content of genes that do (open circles) or do not (shaded circles) have pseudogene counterparts in the other three genomes examined. Note that in all genomes, genes that become pseudogenes are of significantly lower %G+C.

This Article

  1. Genome Res. 14: 2273-2278

Preprint Server