
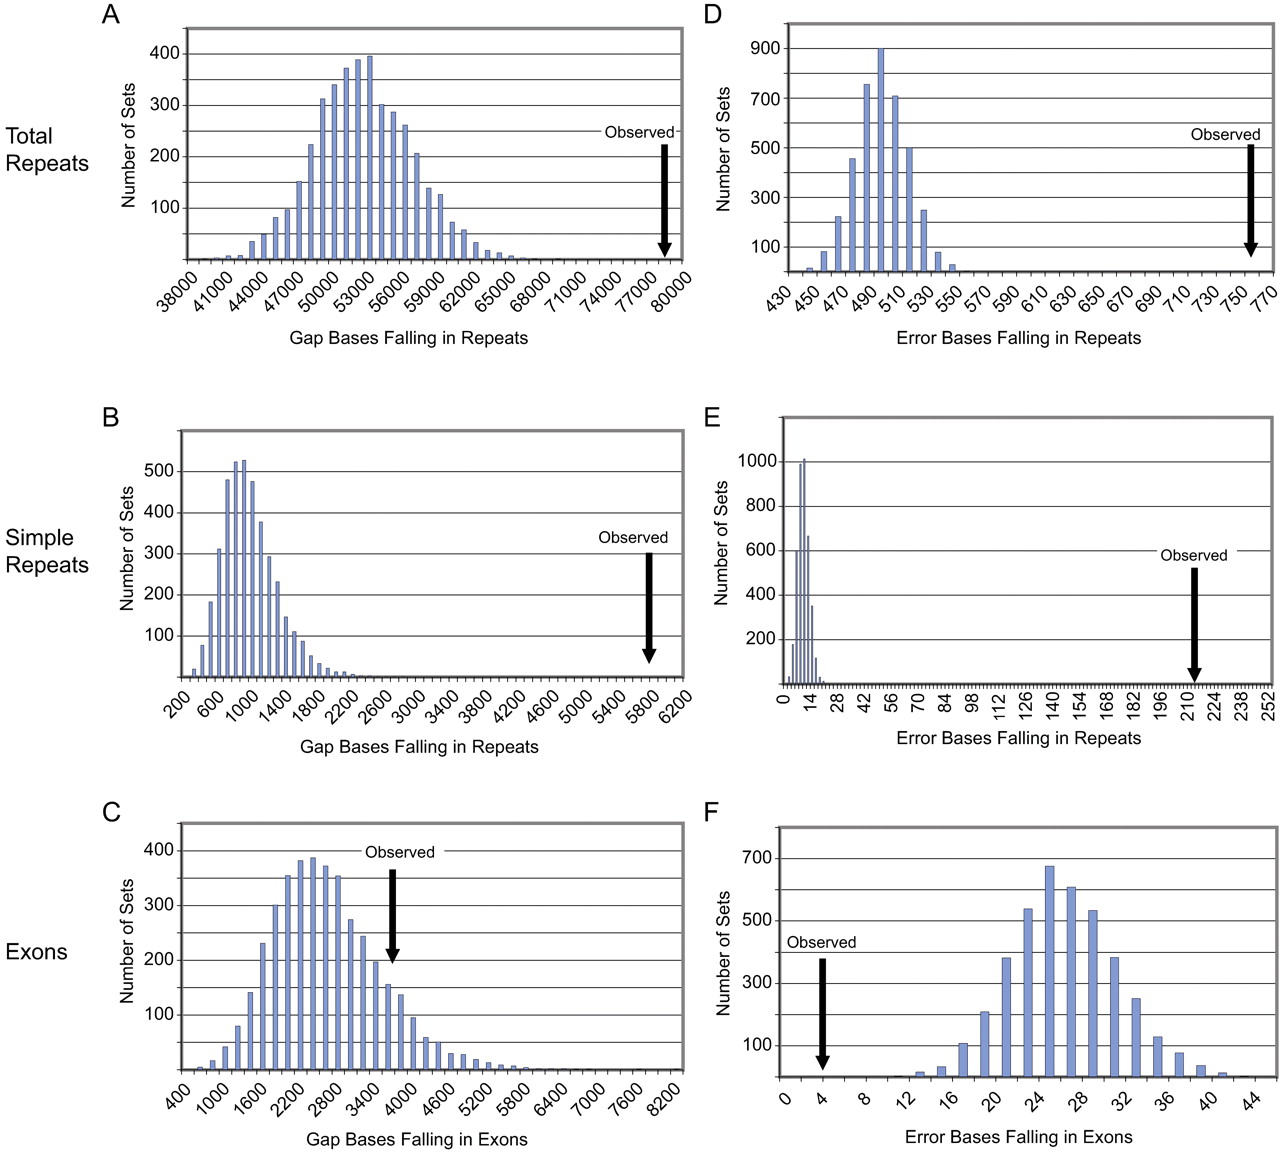
Analysis of gaps and errors in comparative-grade finished sequence by simulation studies. The histogram bar heights reflect the total gaps or errors falling within each class of annotated sequence (total repeats [A,D], simple repeats [B,E], and exons [C,F]) for the simulated data sets. The arrows point to the observed values with the generated comparative-grade finished sequence (for additional details, see Methods). Note that the observed low level of sequence errors falling in exons (F) likely reflects the fact that the generation of simulated data sets assumes a uniform distribution of errors across repetitive and nonrepetitive sequence (which in reality is not seen).


