
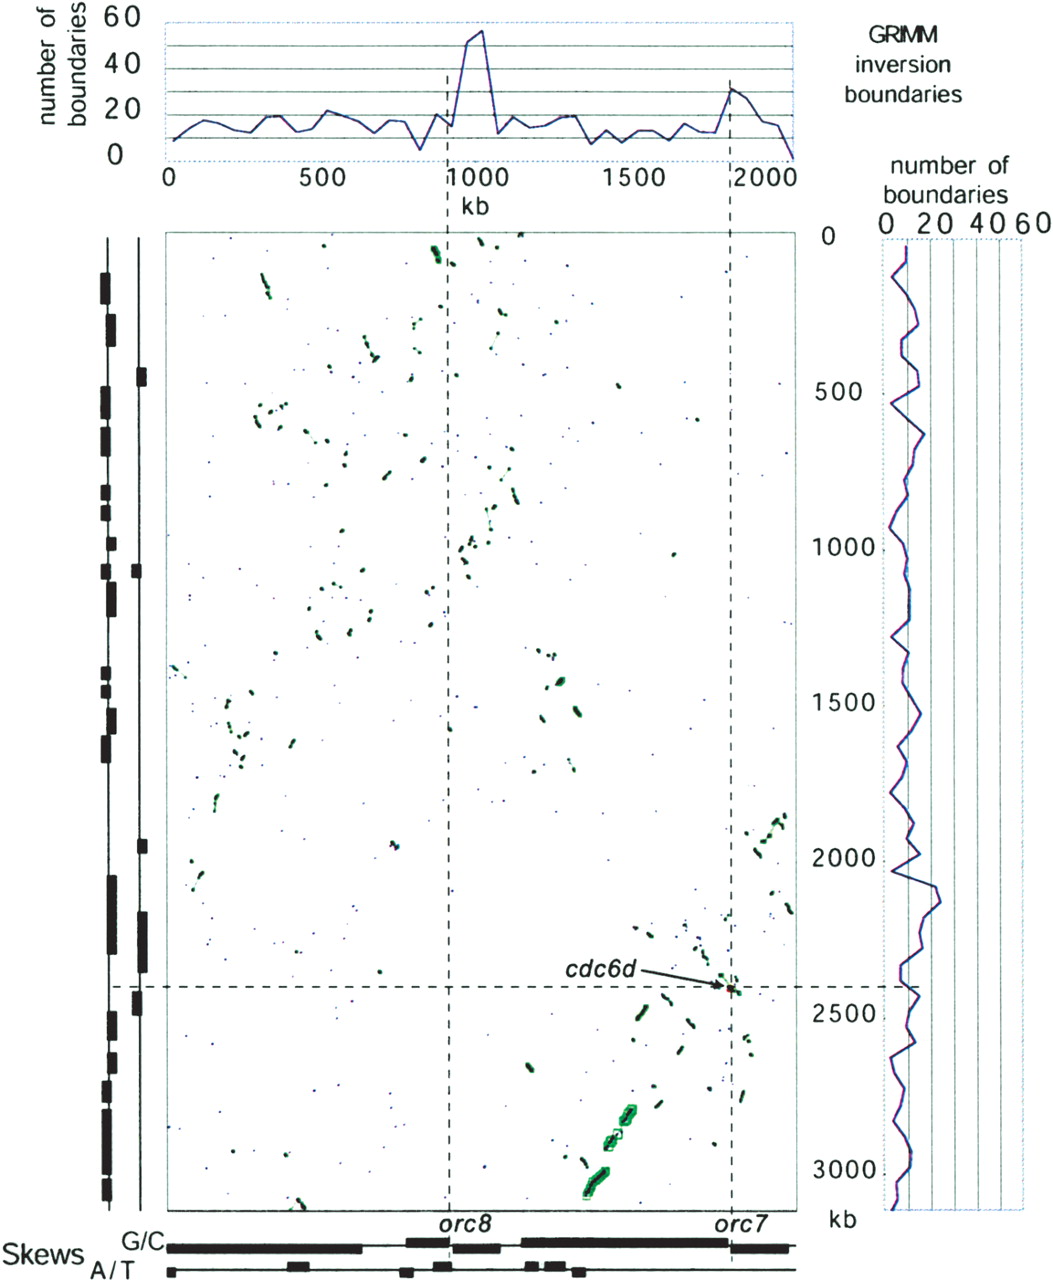
Evolutionary comparison between the main chromosomes of H. marismortui (vertical axis) and Halobacterium sp. NRC-1 (horizontal axis). Scales are equal and in kilobasepairs (kb). Blue points in the dot-plot indicate the location of putative orthologous genes. Green boxes and lines indicate membership in ADHoRe clusters; larger boxes correspond to more populous clusters. The location of the cdc6d/orc7 orthologous pair is indicated in red. The graphs above and to the right depict the distribution of inversion boundaries as identified by GRIMM. Regions of significant nucleotide skews (absolute Z-score higher than three) are depicted in the graphs below and to the left of the dot-plot. Dotted lines are included as an aid for visualization.


