
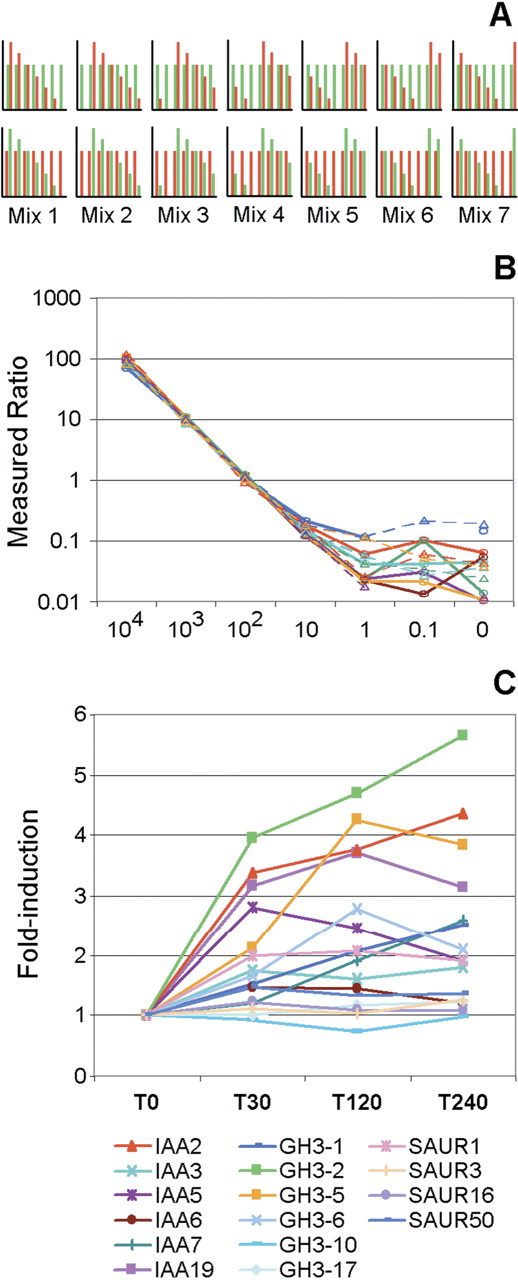
Microarray results. (A) Spiking experiment: Schematic representation of the hybridization series. Each graph shows the spike mRNA content of one microarray hybridization, both in the Cy3 (green) and Cy5 (red) labeled RNA mix. Each bar in a graph represents the concentration of a pair of spike RNAs in an RNA mix (Supplemental Table S3). The numbers indicate the seven scaled RNA mixes containing staggered spike RNAs. The two series of seven graphs represent the reciprocal dye-swap hybridization series in which the reference RNA, containing each of the spike RNA at 100 copies per cell, is labeled either with the Cy3 (top) or Cy5 (bottom) fluorophore. (B) Spiking experiment: Average signal ratios for 13 GSTs corresponding to the spike RNAs across the dilution range expressed as the number of copies per cell. Ratios are represented left to right from the highest to the lowest concentration for all spike RNAs in the seven RNA mixes. As expected, spike RNAs at a 100 copy-per-cell concentration yield a ratio of 1. (C) IAA treatment experiment: Fold induction of known auxin-inducible genes in the Aux/IAA, GH3, and SAUR families.


