
Figure 4
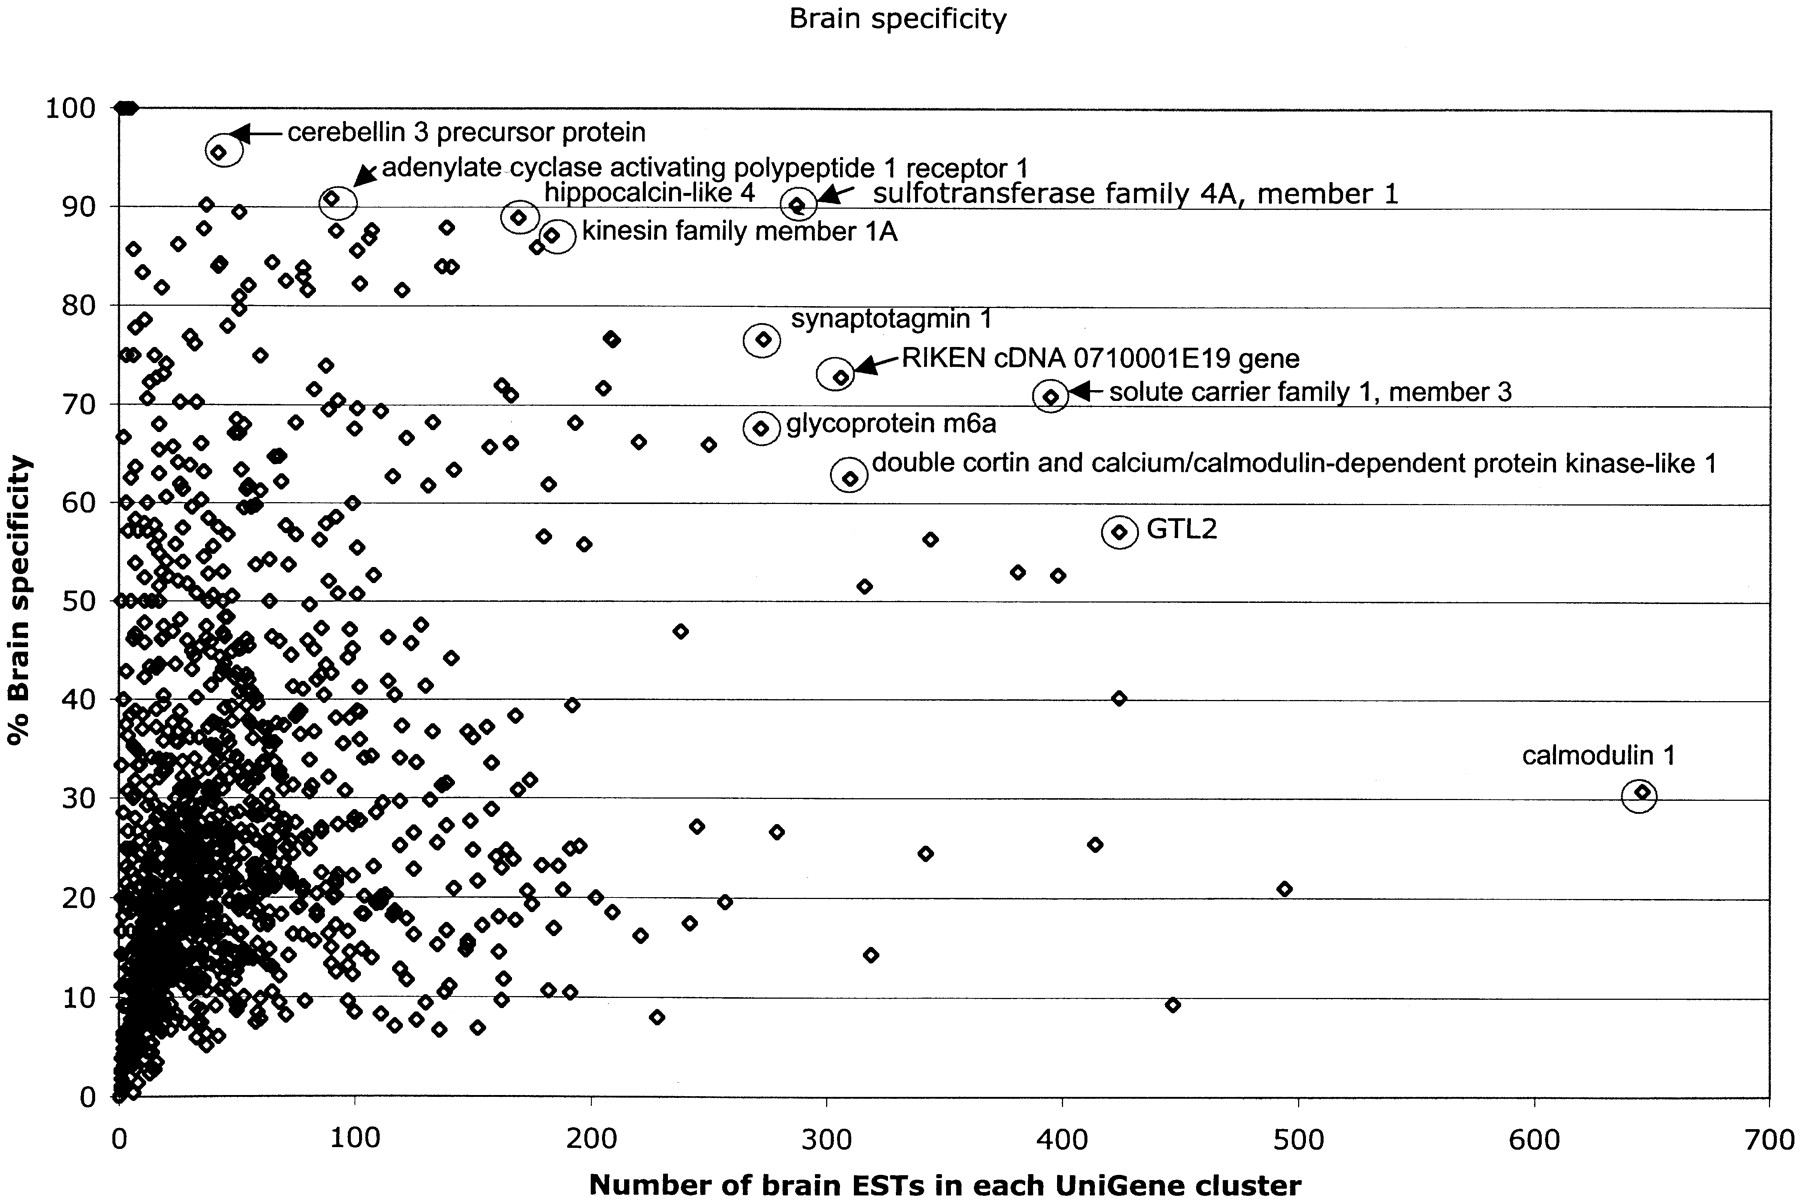
Graph of brain-specific versus EST composition. Gene identities were annotated for several of the most prevalent and most brain-specific clusters.
(Downloading may take up to 30 seconds. If the slide opens in your browser, select File -> Save As to save it.)
Click on image to view larger version.
Graph of brain-specific versus EST composition. Gene identities were annotated for several of the most prevalent and most brain-specific clusters.
 CiteULike
 Delicious
 Digg
Digg Facebook
 Google+
 Reddit
 Twitter
