
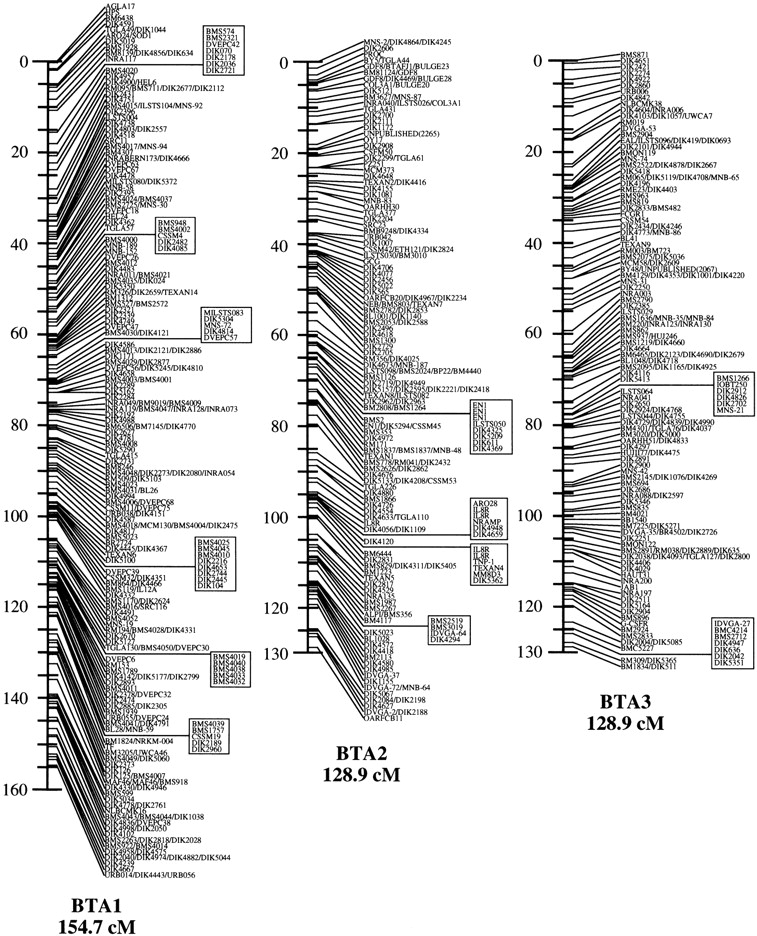
Figure 1
Diagrams of linkage groups for 29 sex-averaged and a female-specific X-chromosome with a male-specific pseudoautosomal region. All markers are indicated as the locus name based on the MARC database, whose detailed information is available from the Supplemental table. The markers in a row or within a box indicate no recombination between them. Genetic distances between markers are given in centimorgans (cM).


