
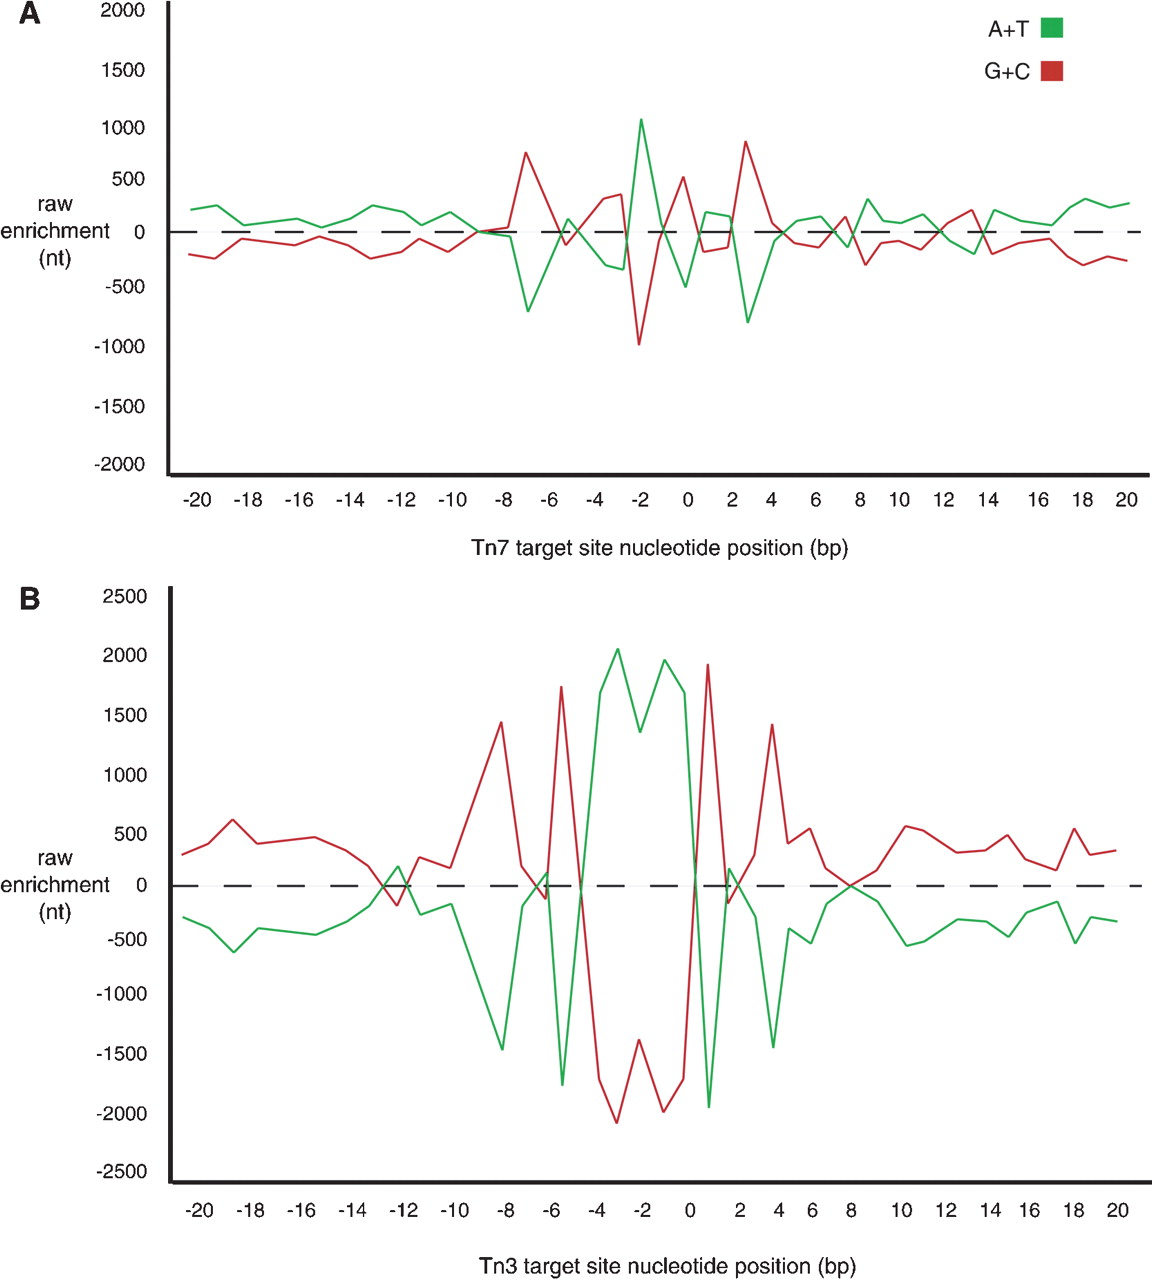
Nucleotide composition of Tn7 and Tn3 target sites. (A) Graph charting enrichment of A/T and G/C at Tn7 target sites within a 41-base pair window centered on the position immediately upstream of transposon insertion (position “0” on the x-axis). As in Figure 5, the x-axis indicates nucleotide position within the window. As the yeast genome tends to be GC-rich, the y-axis here indicates the enrichment of A/T or G/C at each position in raw numbers of nucleotides. Any point near 0 on the y-axis indicates little deviation from the norm in A/T or G/C content. (B) Graph of A/T and G/C enrichment at Tn3 target sites. Note the AT-rich sequence present in the 5-base pair duplicated region associated with Tn3 transposition (positions “-4” to “0”).


