
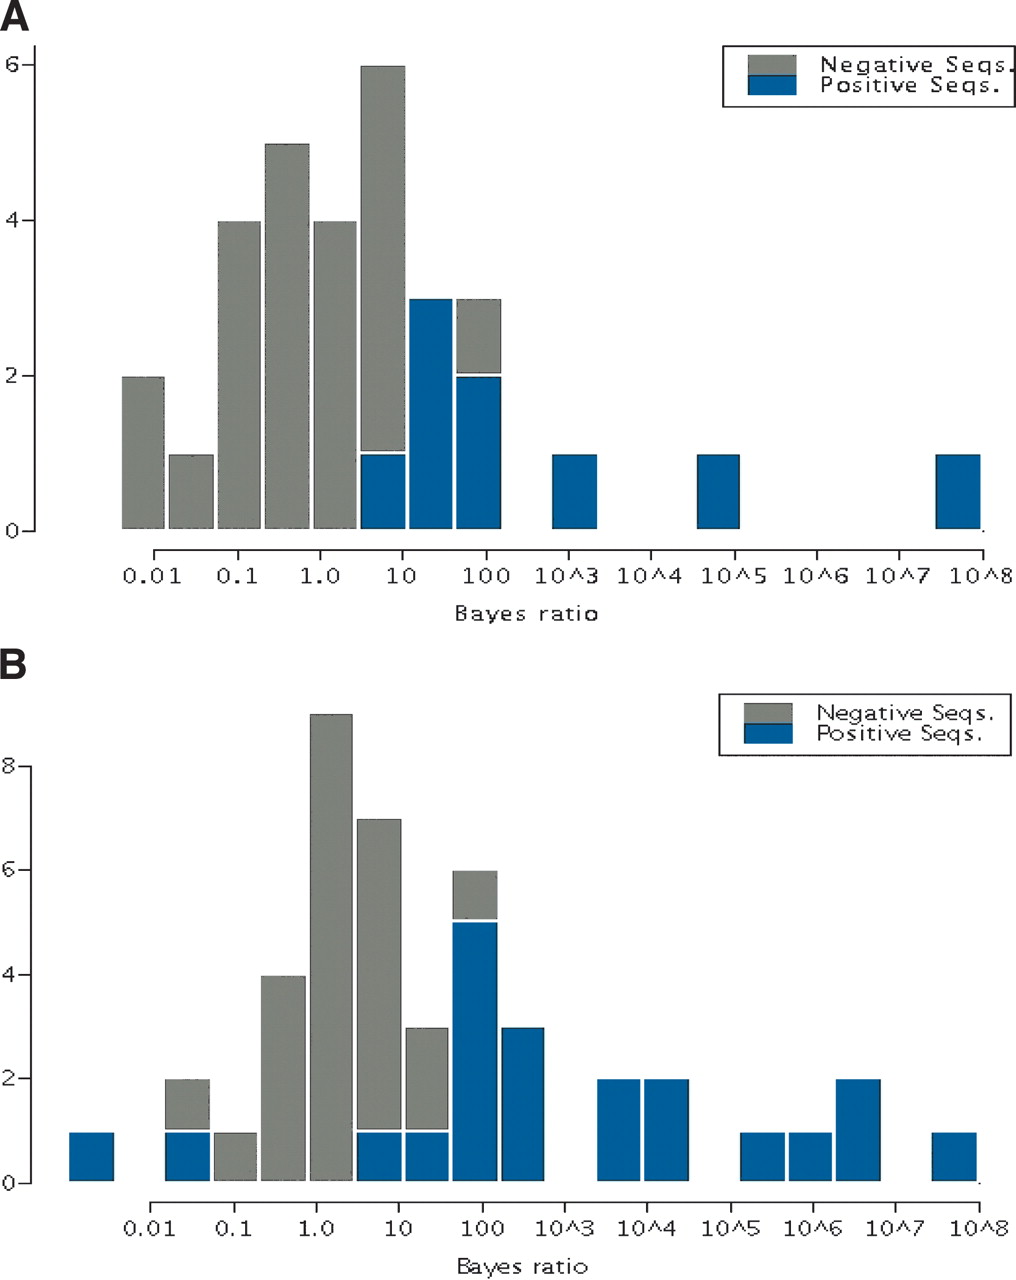
Figure 3
(A) Histogram of the Bayes ratio, on a log10 scale, for the positive and negative validation sequence pairs in which a module was predicted. There are nine positive sequences with a predicted module, and 22 negative sequence pairs. (B) The distribution of Bayes ratios, on a log10 scale, for positive and negative training sequences from cross-validation which contained a predicted module. A rebuild of the models was required for only the 24 negative pairs with predicted modules from the original negative training set, as the other sequences contributed nothing to the model.


