
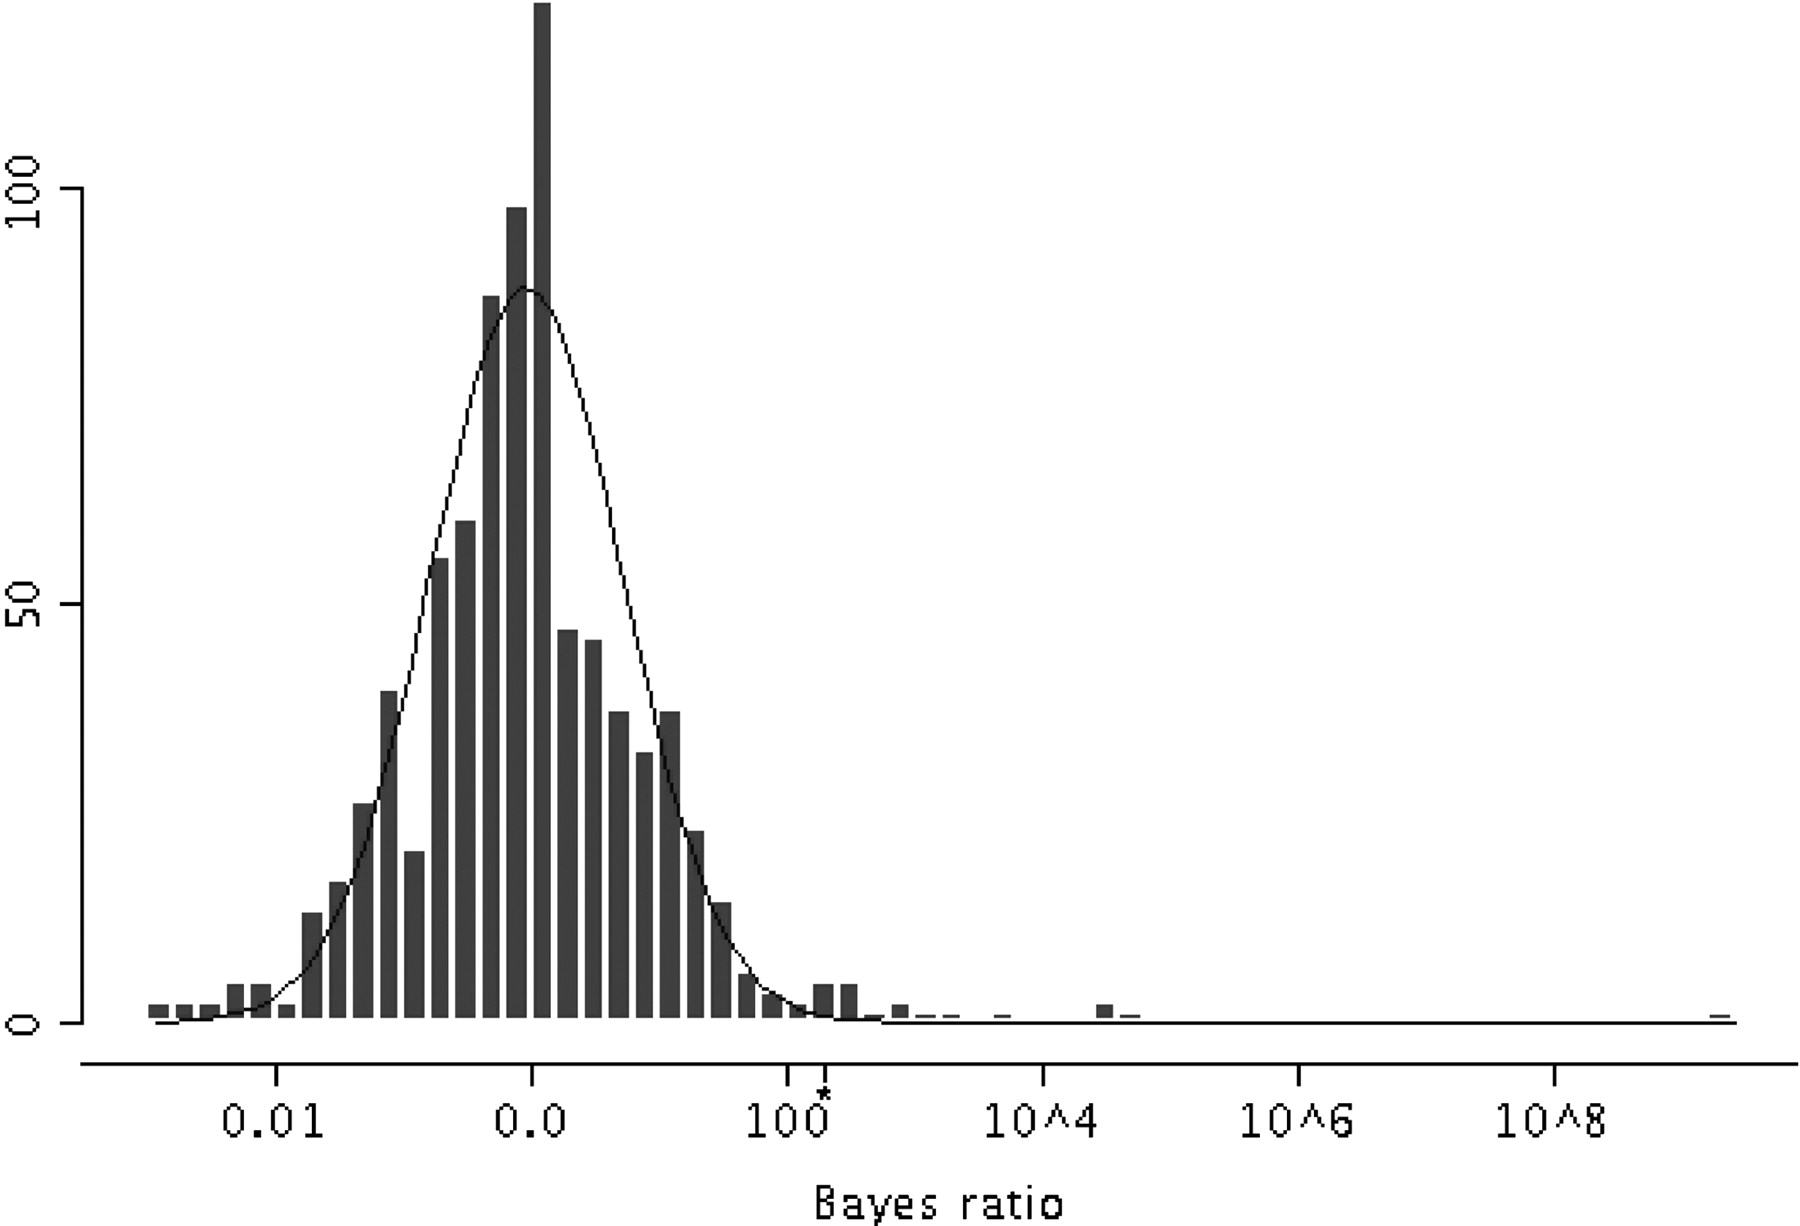
Figure 2
Histogram of the Bayes ratios for 688 intergenic pairs from the human and mouse genomes, that had predicted modules, plotted on a log base 10 scale. The asterisk at log10(194.5)∼2.3 indicates the position of the Bayes ratio cutoff. Sequences above this point have a q-value ≤ 0.05. The line shows the robust fit to the Bayes ratio distribution.


