
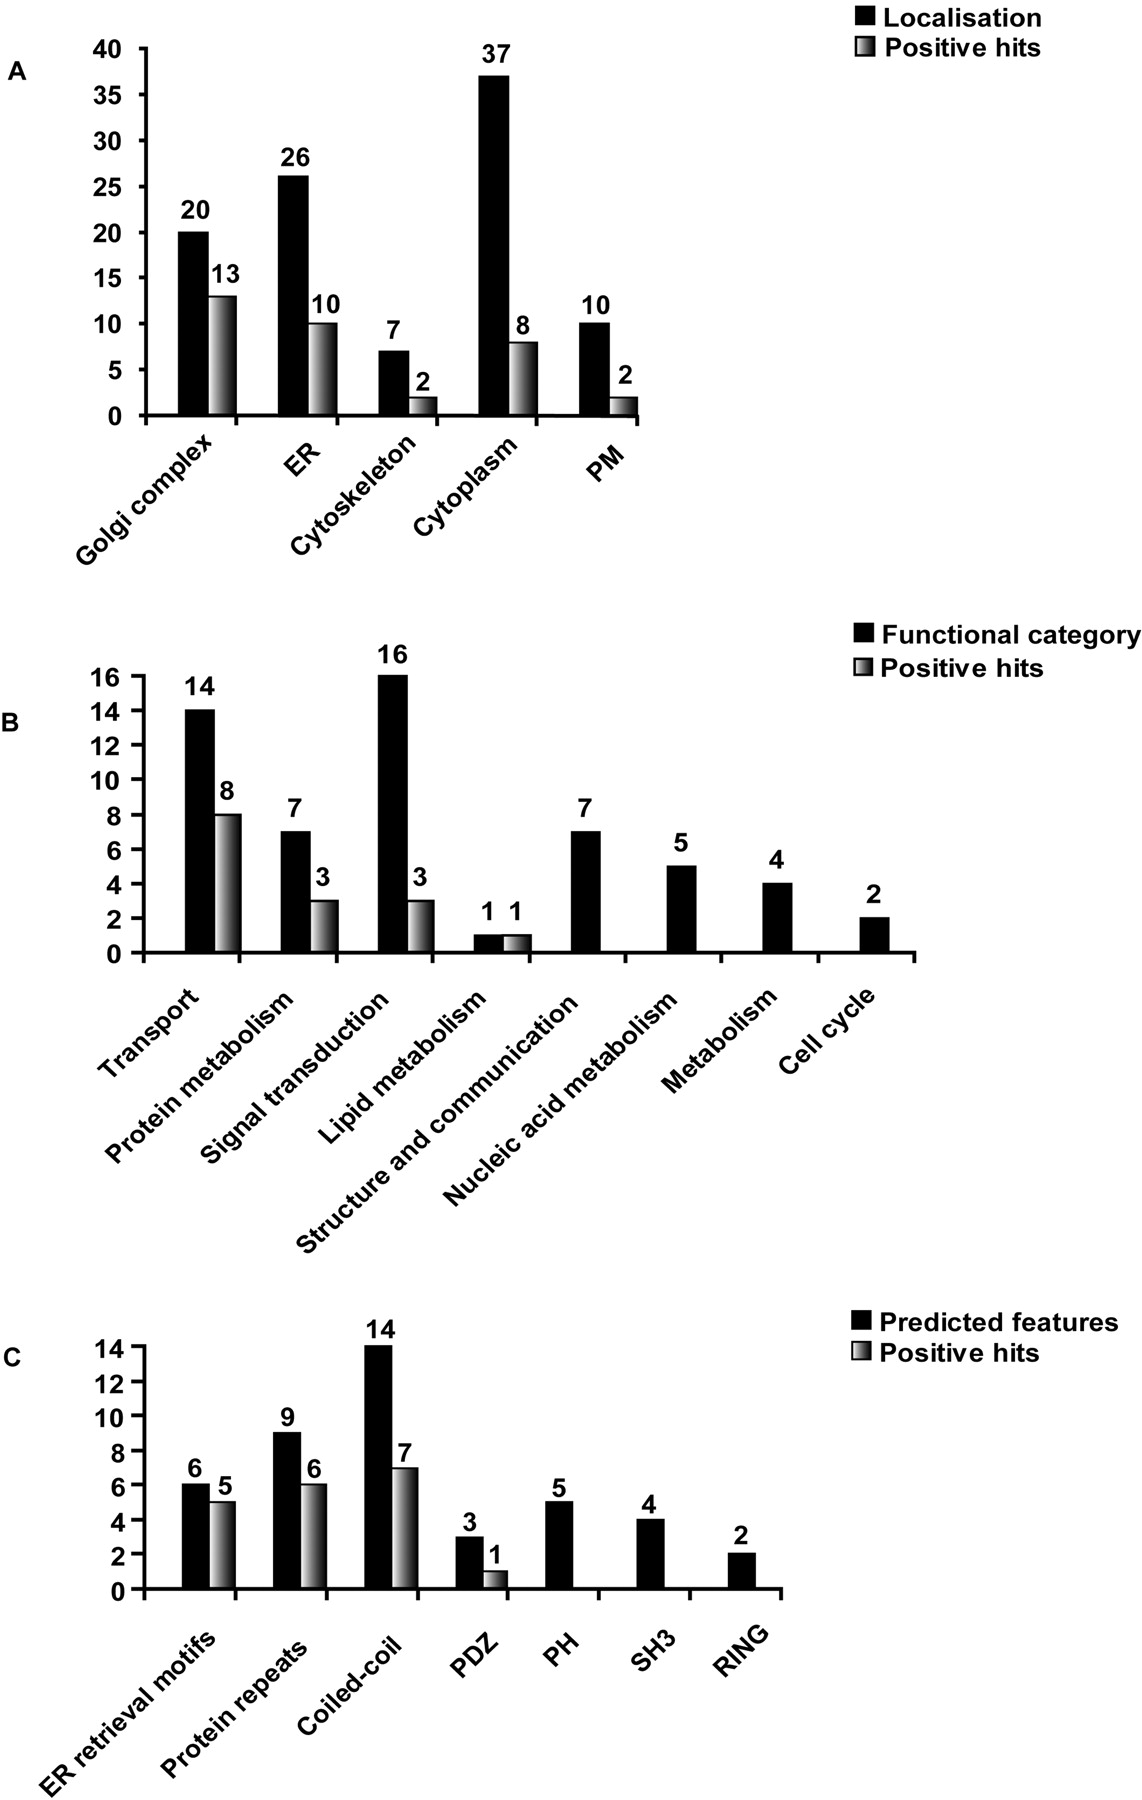
Correlation of the data of functional analysis with the classes of localization and bioinformatic predictions. (A) Number of the positive hits according to classes of subcellular localization. Black bars show the number of proteins tested (100) and the gray bars the number of transport or Golgi morphology effectors identified. (B) Repartition of 56 proteins into the predicted functional categories (black) and hits revealed in these groups (gray). The remaining 44 proteins of the 100 screened were classified as unknown and are thus not shown. Among those 20 were effectors in our screens. (C) Repartition of (including the ones with predicted function) proteins into groups according to their sequence features (black) and hits revealed in these groups (gray). The remaining 57 proteins carried no predictable sequence features and are not shown; 16 of those were effectors in our screens. Proteins were considered to be effectors regardless of whether the N- or C-terminal or both tagged versions of the protein were identified as effectors in our assays.


