
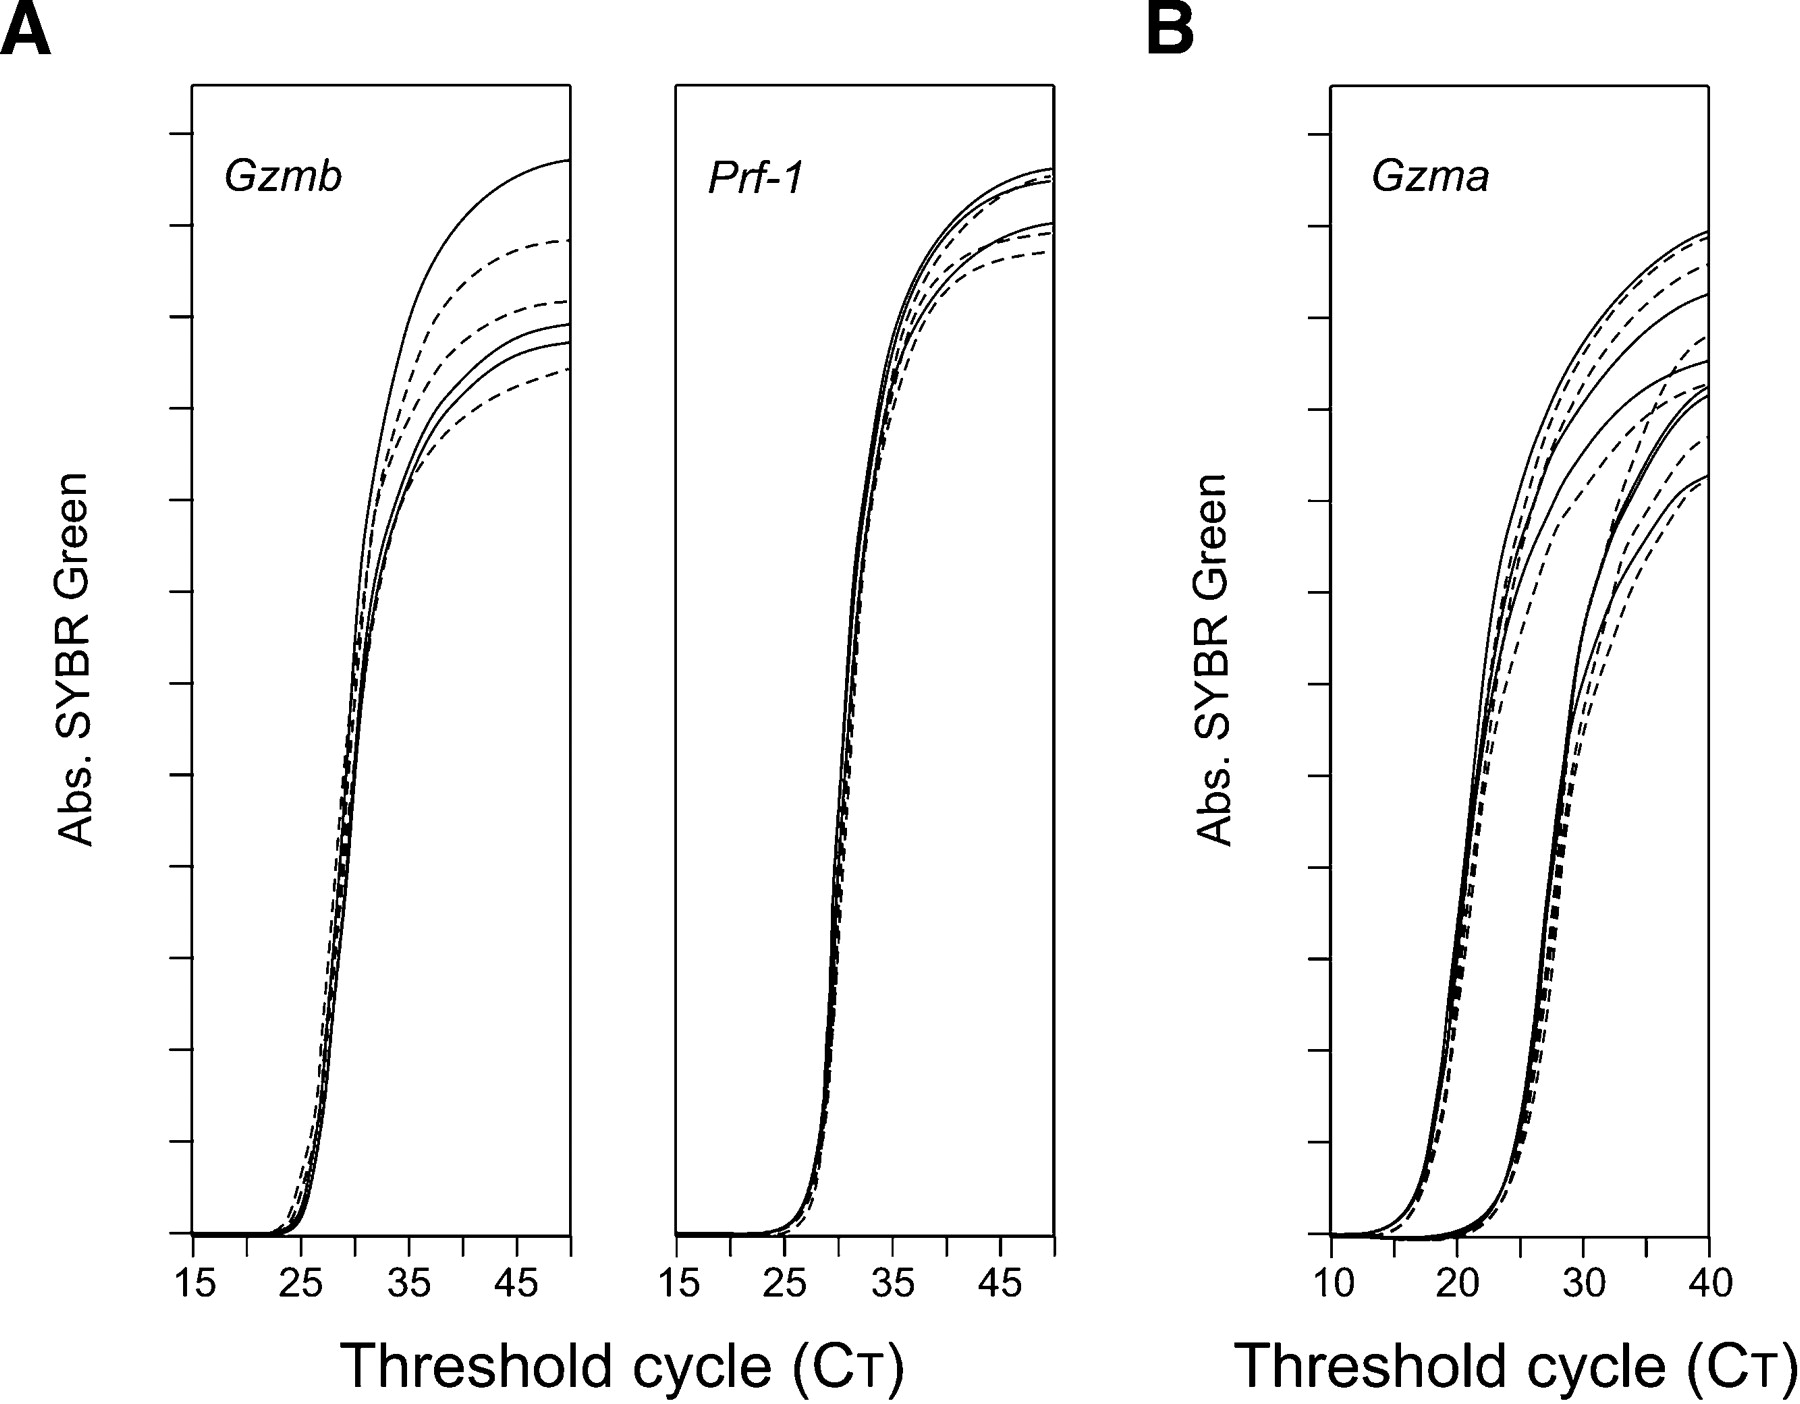
Efficiency of the reverse transcription. Gzma, Gzmb, and Prf-1 RNA and DNA molecules were synthesized and purified. RNA was first retrotranscribed and subsequently amplified; DNA sequences were amplified directly following the same conditions as for cDNA. For each gene the same number of DNA and RNA molecules was compared. Results show triplicate amplifications of RNA (solid lines) and DNA (dashed lines). (A) Comparison of RT efficiency of the same number of RNA molecules coding for different genes. Gzmb (left) or Prf-1 (right). (B) RT efficiency at different RNA concentrations. Different concentrations of Gzma RNA (ranging from 7.5 × 10⁷ to 3 × 10⁵ molecules) and corresponding DNA concentrations were compared. Results show RNA/DNA amplifications at two of the concentrations tested: 1.9 × 10⁷ and 4.7 × 10⁶ molecules. The same results were obtained for all other concentrations.


